
 Yahoo Finance
 Intel: Value Stock or Value Trap?
Semiconductor stocks have suffered mightily as the economic slowdown has shifted consumers’ focus to necessities rather than spending on technology products. Affordable food, clothing, and shelter become critically important during high inflationary periods with mortgage rates reaching their highest levels since the financial crisis in 2008.
The semiconductor industry is very cyclical, making the current market environment more treacherous for these equities. Still, the decline in Intel INTC has been somewhat monumental. Investors have seen rival Advanced Micro Devices AMD grow up and rip away market share from Intel right in front of their eyes over the last five years.
This poses the question, at current levels is Intel still a value stock, or is it now a value trap?
Let’s take a closer look at INTC’s fundamentals and outlook to get a more elaborate answer to the question.
Performance
Intel stock has tumbled -47% year to date, almost double the S&P 500’s -24% decline. However, this has been the case for the Semi-General Market as a whole with Intel’s Zacks Subindustry down -48% YTD, with AMD down -52%.
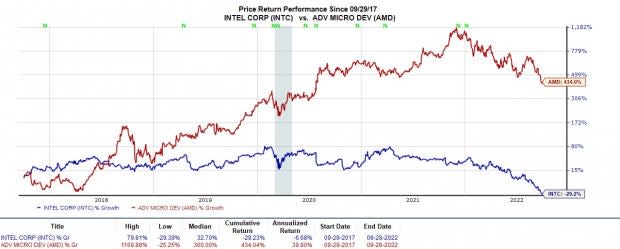
Image Source: Zacks Investment Research
Despite the current unfavorable market environment for semiconductor stocks, Intel’s fall began some years prior. From the above chart, we can see the astonishing performance comparison to AMD. Over the last five years, AMD is up an impressive 434% vs. INTC’s subpar -29% decline.
The price-performance chart also symbolizes AMD taking market share from Intel as they began competing for PC and server chips. AMD surpassed Intel in terms of market cap during the second quarter, which was well noted by investors and analysts, intensifying concerns that Intel is now a value trap.
Intel posted poor earnings during the second quarter, which gave way to AMD officially passing INTC in terms of market cap. INTC missed second-quarter earnings expectations by 58% with earnings of $0.29 a share. This represented a 78% decrease from Q2 2021 with GAAP revenue down 22% as well.
Outlook
Third quarter earnings are expected to be down -80% from the year prior at $0.34 a share, based on Zacks estimates. Third quarter sales are also projected to fall-19% at $15.57 billion.
Year over year INTC’s annual earnings are projected to drop -59% in 2022, but its FY23 earnings are expected to grow 16%. Top line growth is expected in FY23 with sales up 3% at $68.23 billion but this year’s sales are expected to be down 15%.
During its second-quarter earnings release, Intel mentioned its Client Computing, Datacenter, and AI Groups were largely impacted by continued adverse market conditions. The company did highlight that its Network, Edge Group, and Mobileye units achieved record quarterly revenue.
CEO Pat Gelsinger said second-quarter results were below company standards and that Intel must and will do better for its shareholders. Intel recently launched its 13th-Gen chip and expanded its developer cloud to have a better chance at competing with rivals AMD and Nvidia NVDA.
Valuation
Trading around $27 a share, INTC has a forward P/E of 11.9X, which is still above the industry average of 10.6X. This is below the high of 16X over the last five years and near the median of 12.1X.

Image Source: Zacks Investment Research
Despite the low P/E, EPS estimate revisions have continued to trend down for INTC over the last 60 days. One thing that is favorable for INTC is its low forward EV/EBITDA at 4.81X vs the market average of 11.8X as shown in the above chart. This indicates Intel has an impressive balance sheet with access to cash and a strong total debt-to-asset ratio. This is also the lowest Intel’s EV/EBITDA has been over the last 20 years.
The low EV/EBITDA is critical for Intel during economic uncertainty in the semiconductor industry.
Bottom Line
Unfortunately for Intel and its shareholders, the stock looks more like a value trap even at current levels. INTC currently lands a Zacks Rank #5 (Strong Sell) in correlation with the declining earnings estimate revisions and tough economic environment for semiconductor stocks. The Semiconductor-General Industry is currently in the bottom 15% of over 250 Zacks Industries. Increasing competition which has been evident in the loss of market share to AMD has also continued to weigh on Intel’s stock.
This is not to say that Intel can’t eventually turn things around and regain its footing as a semiconductor power. INTC has a low EV/EBITDA and strong cash flow to help with the process. For now, investors may want to be cautious of INTC stock.
Want the latest recommendations from Zacks Investment Research? Today, you can download 7 Best Stocks for the Next 30 Days. Click to get this free report
Intel Corporation (INTC) : Free Stock Analysis Report
Advanced Micro Devices, Inc. (AMD) : Free Stock Analysis Report
NVIDIA Corporation (NVDA) : Free Stock Analysis Report
To read this article on Zacks.com click here.
Zacks Investment Research
