
 Yahoo Finance
 Here's what's preventing a freefall in stocks: trader
U.S. equity markets were under pressure again today, building on the negative sentiment that emerged last week, wherein stocks moved decidedly in two directions. At the outset of the week, equity markets stepped smartly higher, and in the process, helped temporarily allay fears that a sharp move lower and retest of 2581 was in the cards after the previous week’s elevated volatility and dramatic pullback. That brief two-day pause for investors was upended by several themes, not the least of which is the rising yield of 10-year Treasury Note (^TNX), which climbed to 2.99% today.
Though equity market investors have certainly had plenty of variables to take into account in recent months — variables that have undermined confidence and triggered a meaningful pullback in prices and a dramatic increase in volatility — rising interest rates have largely been overlooked. That is, until late last week.
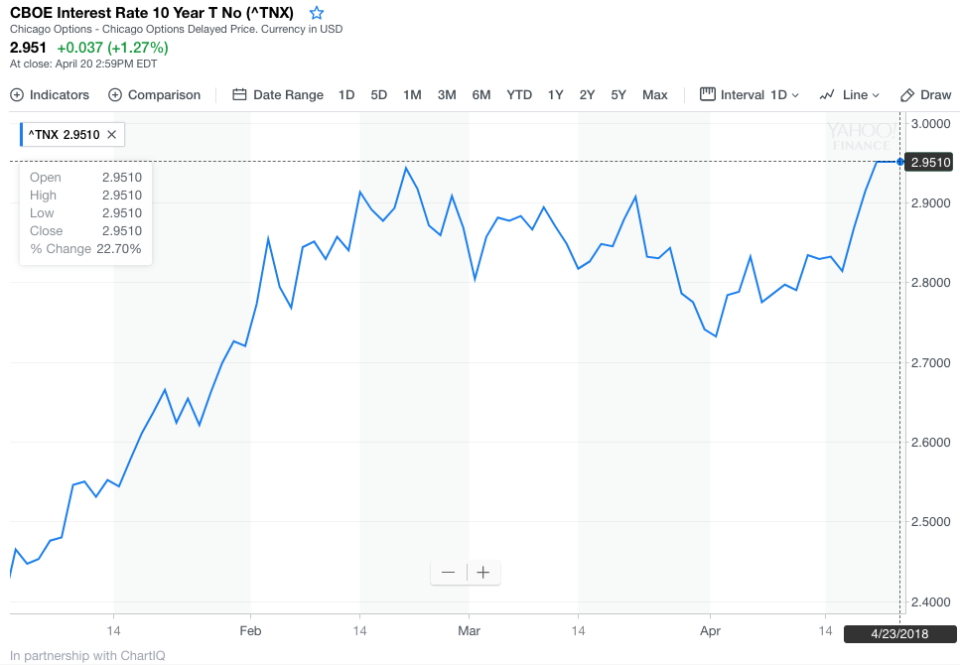
Since February 8, when the S&P 500 (^GSPC) registered a low of 2581, the yield on the 10-year has risen from 2.85% to Friday’s multi-year high of 2.95%. That move higher in yields has taken the 10-year within a hair of the all-important 3% level. The last time the 10-year traded above 3% was on December 1, 2013. Many on the Street feel as though a 3% yield on the 10-year is a tipping point of sorts. It is considered an important inflection point for a variety of reasons – not the least of which is that it reflects a meaningful alternative to equities for investors. Additionally, given the fact the S&P 500 closed on Friday still off 7% from the highs registered on January 26, we already see a degree of rotation out of equities as investors increasingly have looked to reduce exposure to perceived risk and continued elevated valuations.
Another warning sign for investors has emerged as a result of rising short-term rates (^IRX): a flattening yield curve. Historically, flattening yield curves, and the potential for an inverted yield curve, speak to late-stage economic expansion and a likely turn lower in economic activity and equity prices as a result. Though not a certainty of additional weakness in equities, the trends in recent equity and credit market trades do signal a degree of stress in the market.
Rising interest rates not only affect consumers, more importantly, they impact the US Treasury adversely. Broadly, the cost of borrowing across the entire economic landscape is impacted. Rising borrowing costs, coupled with weak equity prices and elevated valuations, concern over trade wars, and clear signs of rotation out of equities just weeks into Q1 earnings season all call for increased caution.
The rising cost of energy also provides headwinds for investors and consumers alike, and WTI crude oil (CL=F) closed at a multi-year high on Friday. Increased US and global consumption, coupled with temporarily crippled Canadian production and curtailed OPEC production, have provided additional momentum to rising prices. Energy is a critical component of inflation. Rising prices have broad implications for consumers and interest rates indirectly as well.
Last week’s economic calendar provided some encouraging data for investors. On Monday, retail sales for March came in at 0.6%. The Empire State Mfg. Survey for April was 15.8, and business inventories for February were a solid 0.6%. Housing starts for March were a stronger-than-expected 1.319 million versus Bloomberg consensus of 1.264 million. Also released on Tuesday was industrial production data for March. It came in at 0.6% — higher than Bloomberg consensus of 0.4%. Acting as a tailwind for higher energy prices, the EIA Petroleum Status report reflected a draw in all three verticals. Weekly jobless claims remained in-channel at 233K – suggesting continued strength in the job market and broader economy.
This week’s calendar
Highlights for this week’s calendar include the Chicago Fed National Activity Index today, which came in at 0.10 versus expectations of 0.29, the FHFA Home Price Index on Tuesday, the EIA Petroleum Status Report on Wednesday, durable goods on Thursday and GDP on Friday. I expect the economic data to continue to provide a constructive landscape for investors while earnings continue to provide a counter-balance to the headwinds outlined above. Trading will remain trendless as equity markets look to further establish a base with which to trade higher.
Commentary by Sam Stovall, CFRA chief investment strategist
Based on the S&P 500’s potentially successful April 2 retest of the February 8 low, the market appears to be clawing its way back to break even from the 10.2% correction, on a closing basis, from the January 26 high. (Corrections are defined as closing price declines of 10% to 19.9%.) Should this correction indeed be over, it will have recorded the quickest peak-to-trough sell-off (13 calendar days) for all 21 completed corrections since WWII, versus the average of 143 days. In addition, the S&P required an average of 71 calendar days to recoup all that it lost, while the swiftest recovery required only 32 days following a 12.1% correction in 1999. History also implies, but does not guarantee, that once we got back to break-even from the 11 quickest corrections (sub-100 days to hit bottom), the S&P 500 rose an average 6.8% over 73 calendar days before slipping into another decline of 5% or more.
