
 Yahoo Finance
The Grinch Returns On STI This Christmas
The Straits Times Index (STI) posted a record high performance of approximately 18 percent in 2017. However, this year, performance took a turn south after peaking in May 2018. At the time of writing, the local benchmark is down about 14 percent since the beginning of the year.
It has been mostly a tumultuous year for Singapore equities. With slightly less than a week before the New Year, even the Christmas holiday failed to lift spirits. Going into 2019, how should investors thread and what sectors should investors look into?
Santa Claus Not Smiling
Chart 1: Straits Times Index
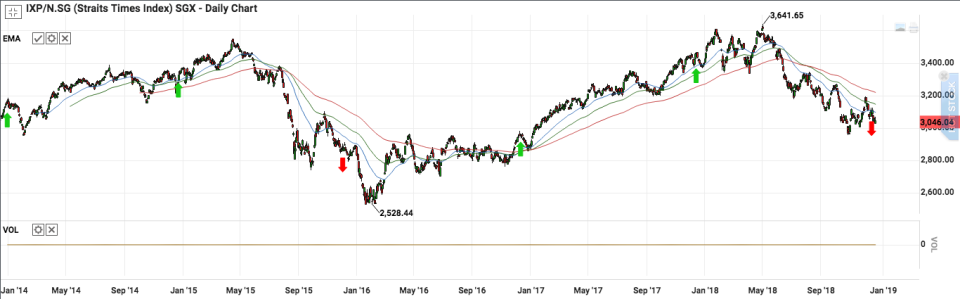
Source: Phillip Securities (21 December 2018)
From Chart 1, we reviewed the five-year daily chart of the STI from 2014 till 21 December 2018 (YTD). In four of the six Christmas occasions we have tracked, there had been a rally for the STI of between 5 to 20 percent. There were two Christmas occasions – in 2015 and 2018 – where STI fell into the negative territory. Incidentally, 2015 poor performance was marked by China’s Yuan currency devaluation which caused significant global market upheavals. It was also in that year when the US Federal Reserve began to tighten its monetary policy after years of quantitative easing (QE) programme.
Fast forward to 2018, the STI is similarly weighed on by a myriad of geopolitical issues. In the US, the Federal Reserve continued to raise interest rate while Trump has just shut down the government before Christmas as the US Senate failed to pass a bill that would meet his demand for a border security wall.
Meanwhile, oil prices have fallen below US$60 per barrel again, as China growth rates begin to be impacted by ongoing trade war. The uncertainties weighing on the outlook towards 2019, prompted investors to seek safe havens and this is now being reflected in STI.
Which Sectors In STI Are Lagging?
The Financial Services and Real Estate sectors have been facing the brunt of the global sell-off. The three banks, DBS, UOB and OCBC have each saw their stock prices declining by 5 to 11 per cent since the start of the year.
Chart 2: FTSE ST Financials Index
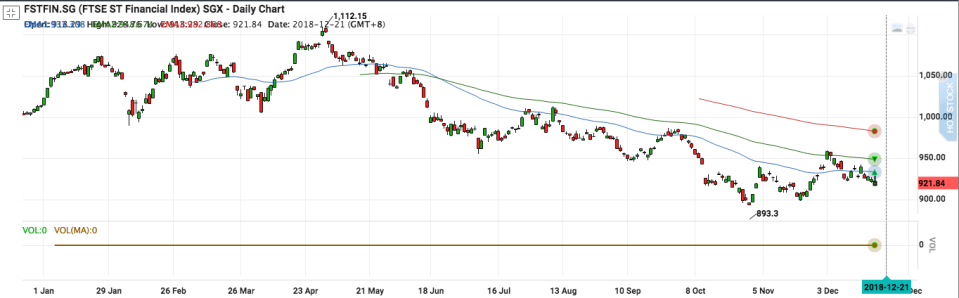
Source: Phillip Securities (21 December 2018)
From the one-year daily of Chart 2, we saw that the FTSE ST Financial Index has declined by 9 to 10 per cent since the start of the year. However, if investors were to look past the fall in valuations and focus purely on the dividend yields, most of the banking counters are yielding about four to five percent per annum on average.
Chart 3: FTSE ST Real Estate Holding and Development Index

Source: Phillip Securities (21 December 2018)
Meanwhile, for the real estate sector, we have CapitaLand, City Developments Limited (CDL), and UOL Group making up the three main property developers on the STI. Though the sector had a promising start during the first half of 2018, stock performances started to deteriorate post-05 July’s property cooling measures.
The real estate sector, as represented by the FTSE ST Real Estate Holding and Development Index, fell 19.2 percent from the start of the year after being hammered by the cooling measures. The sector index is now inching closer to bear market territory of a 20 percent peak-to-trough decline (Chart 3).
How About Ever-popular REITs?
Chart 4: FTSE ST Real Estate Investment Trust
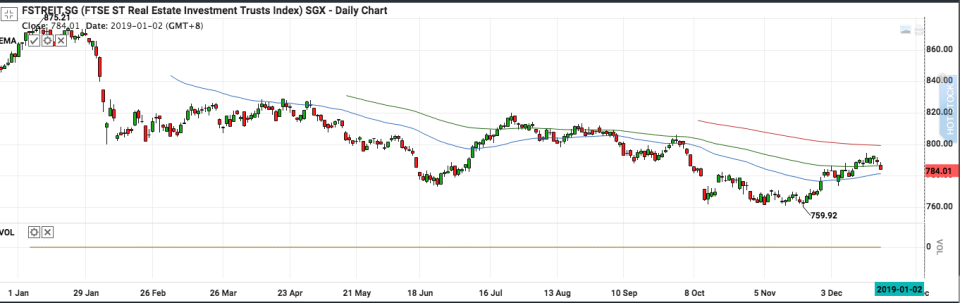
Source: Phillip Securities (21 December 2018)
From Chart 4, the one-year daily chart of the FTSE ST Real Estate Investment Trust (REIT) Index showed a decline of about 9.5 percent since the start of the year, but outperformed the STI.
The STI also comprises the three major Singapore REITs – Ascendas Reit (A-Reit), CapitaLand Commercial Trust (CCT), and CapitaLand Mall Trust (CMT). The three largest REITs by market capitalisation saw their average 12-month dividend yields per annum still hovering around four to five percent which is relatively decent given the current market conditions.
Though REIT prices have also not escaped from the harsh market environment, investors who are looking for some certainty and stability in income payouts may reasonably find these counters reassuring at the end of the day.
STI – A Value Bag
The STI is trading at a historical price-earnings (P/E) multiple of 11 to 12 times. Despite the dismal performance this year, there are still sectors like the banking and REIT sectors that are still offering reasonable dividend returns.
Going forward, the gloomy environment will likely not fade away in 2019. However, given the reasonable valuation multiples for STI relative to other markets, our local market has a bag of stocks that could attract value seekers. In that case, that would be the Christmas blessing in disguise.
Related Article:
