Goldman Sachs and Netflix — What you need to know in markets on Wednesday
Earnings season is ramping up, and Wednesday will feature two of the most recognizable brand names in the public markets.
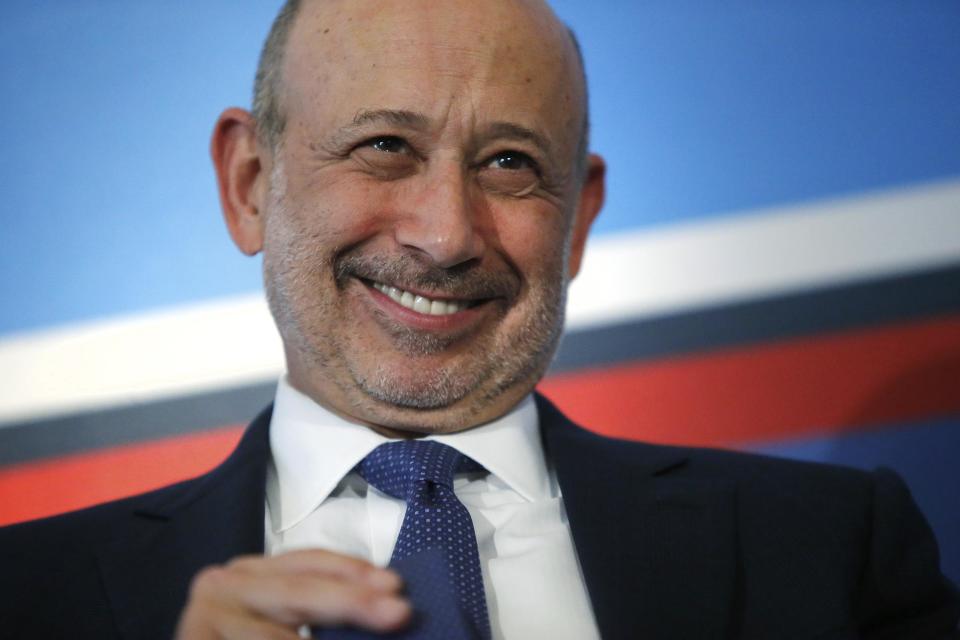
Before the market open, Goldman Sachs (GS) will report earnings. Goldman, which has the largest weight in the Dow Jones Industrial Average, is expected to report adjusted earnings per share of $4.80 on revenue of $7.76 billion, according to estimates from Bloomberg.
Bloomberg notes that Goldman has beat earnings expected in 11 of the past 12 quarters, but shares fell following 7 of its last 12 announcements.
Over the last year, shares of the bank are up a bit over 50%.

Also in the banking space, Citi (C) will report earnings before the market open, and then after the close Netflix (NFLX) will report quarterly results. Netflix is typically one of the most volatile stocks around earnings reports, and according to data from Bloomberg, options pricing is implying a 9% one-day stock move after earnings.
On the economic data side, Wednesday will also be the busiest day of the week, with the December report on consumer prices headlining. Economists expect that on a “core” basis — which excludes the more volatile costs of food and energy — prices rose 2.1% over the prior year.
Wednesday morning will also feature the latest report on industrial production and the January reading on homebuilder sentiment.

The technical setup
Since markets topped out in mid-December, major US stock market indexes have been in a consolidation phase. And after Tuesday’s close, the S&P 500 now hasn’t had a 1% decline in 66 trading days, matching the longest streak of the current bull market, according to data from Bespoke Investment Group.
Eventually, a long consolidation in markets has to resolve in some sort of move higher or lower, with the break from such a range often serving as a decisive move to form at least a short- or medium-term trend. Think about how the tension in markets that was released higher after the election results.
But thinking more broadly in market history, as we enter the first year of a presidential cycle the wind should be at the market’s back.
In a note to clients out last week, Stephen Suttmeier, technical research analyst at Bank of America Merrill Lynch, outlined that the first year of a presidential cycle often sees a dip in February before a 7%-11% rally into the summer. Overall, the first year of a presidential cycle sees about a 5.1% return for the S&P, less than the average historical return.
“The bullish sweet spot of Presidential Cycle Year 1 is March-July, which has an average gain of 7.86% (average March-August rally of 11.15% for a first term President),” writes Suttmeier.
“This fits with the potential for a 10% melt-up in stocks and commodities in 1H 2017 after a January/February wobble as highlighted by [Bank of America Merrill Lynch strategist] Michael Hartnett. The July 2016 bullish new high long pause, S&P 500 pattern projections, and secular bull market roadmap point to 2415-2460 in 2017.”

But what fun would data-mining be if we didn’t go even deeper?
The old markets axe is that as January goes so goes the year. In 2017, the first five days of the year finished higher, which often portends a positive month and, in turn, a better-than-average year.
According to Suttmeier’s data, from 1928 to 2016 the first five days of the year have been positive 58 times, and in 43 of those cases the market has finished the year higher. The average annual return in those years? +10.5%, better than the historical average of 7.5%.
During these 43 instances, 36 times the month of January has also finished higher and in those years the S&P 500 has gained an average of 14.6%. But wait, there’s more!
What happens when the first five days of January finish higher and the month of January finishes higher during the first year of a presidential cycle? Good things!
During nine instances in which both the first five days of January and the month as a whole finished higher during the first year of a presidential cycle, stocks have closed the year in positive territory 8 times.
The average annual return? 18.5%.
—
Myles Udland is a writer at Yahoo Finance. Follow him on Twitter @MylesUdland
Read more from Myles:

 Yahoo Finance
