
 Yahoo Finance
 Gold Trying to Extend Rebound, SPX 500 Indecision Continues
DailyFX.com -
Talking Points:
US Dollar Pauses to Digest Losses After Hitting 4-Month Low
S&P 500 Signals Indecision at Familiar Range Top Resistance
Gold Working to Extend Rebound, Crude Oil Treading Water
Can’t access the Dow Jones FXCM US Dollar Index? Try the USD basket on Mirror Trader. **
US DOLLAR TECHNICAL ANALYSIS – Prices remain in digestion mode after prices slid to the four-month low. A daily close below the 61.8% Fibonacci expansion at 11638 exposes the 76.4% level at 11576. Alternatively, a push above the 50% Fib at 11688 opens the door for a challenge of the 38.2% threshold at 11737.
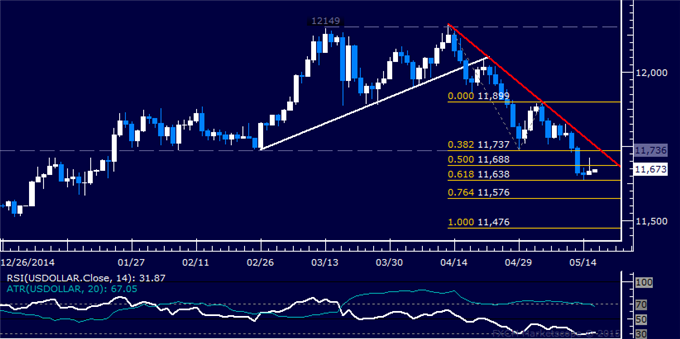
Daily Chart - Created Using FXCM Marketscope
** The Dow Jones FXCM US Dollar Index and the Mirror Trader USD basket are not the same product.
S&P 500 TECHNICAL ANALYSIS – Prices continue to jostle around in a choppy range, waiting for clear-cut direction cues. A daily close above the 2122.10-25.90 area (April 27 high, 38.2% Fibonacci expansion) exposes the 50% level at 2140.70. Alternatively, a reversal below the 23.6% Fib at 2099.10 targets the 14.6% expansion at 2084.90.

Daily Chart - Created Using FXCM Marketscope
GOLD TECHNICAL ANALYSIS – Prices are working on the fifth consecutive day on the upside. A break above the 76.4% Fibonacci expansion at 1231.71 exposes the 100% level at 1250.96. Alternatively, a turn below the 61.8% Fib at 1219.80 targets the 50% expansion at 1210.18.
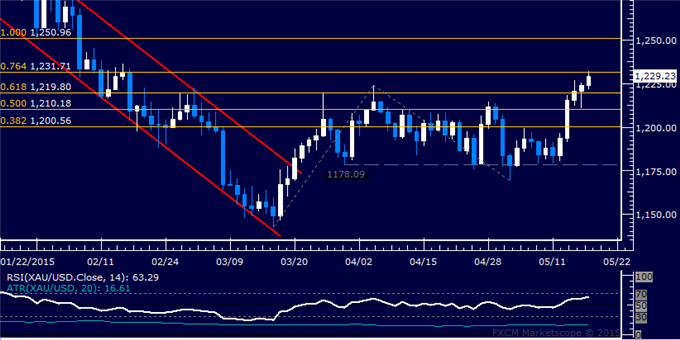
Daily Chart - Created Using FXCM Marketscope
CRUDE OIL TECHNICAL ANALYSIS – Prices are stalling having rebounded from support above the $64.00 figure. A daily close above the 23.6% Fibonacci expansion at 68.23 exposes the May 6 high at 69.60, followed by the 38.2% level at 70.72. Alternatively, a turn below the 14.6% Fib retracement at 66.03 targets the 23.6% threshold at 63.84.
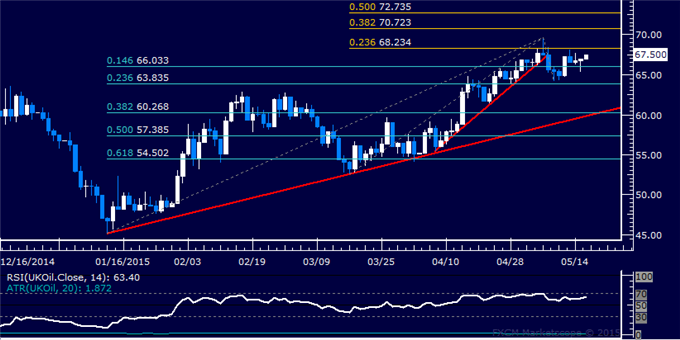
Daily Chart - Created Using FXCM Marketscope
--- Written by Ilya Spivak, Currency Strategist for DailyFX.com
To receive Ilya's analysis directly via email, please SIGN UP HERE
Contact and follow Ilya on Twitter: @IlyaSpivak
DailyFX provides forex news and technical analysis on the trends that influence the global currency markets.
Learn forex trading with a free practice account and trading charts from FXCM.
