
 Yahoo Finance
 Gold Stalls at Chart Support as SPX 500 Digests After Dramatic Drop
DailyFX.com -
Talking Points:
US Dollar Waits for New Direction Cues in Familiar Territory
S&P 500 Pauses to Digest After Dramatic Reversal Downward
Gold Treading Water, Crude Oil Stalls After Trend Line Break
Can’t access the Dow Jones FXCM US Dollar Index? Try the USD basket on Mirror Trader. **
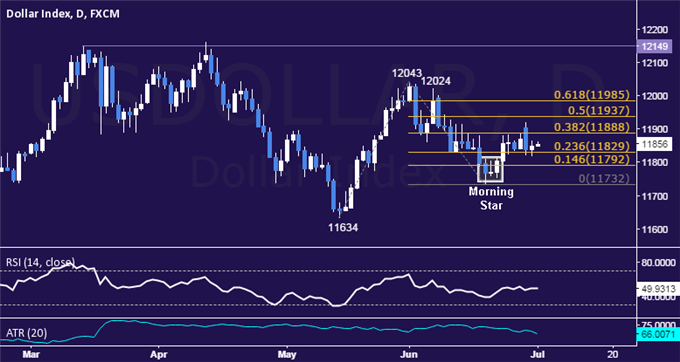
US DOLLAR TECHNICAL ANALYSIS – Prices moved higher as expected after producing a bullish Morning Star candlestick pattern. A daily close above the 38.2% Fibonacci expansionat 11888 exposes the 50% level at 11937. Alternatively, a push below the 23.6% Fib at 11829 clears the way for a test of the 14.6% level at 11792.
** The Dow Jones FXCM US Dollar Index and the Mirror Trader USD basket are not the same product.
S&P 500 TECHNICAL ANALYSIS – Prices are consolidating losses after declining as expected. From here, a break below the 50% Fibonacci expansion at 2052.70exposes the 2032.80-40.10 area (March 11 low, 61.8% level). Alternatively, a reversal above the 38.2% Fib at 2072.60 targets channel floor support-turned-resistance at 2088.90

GOLD TECHNICAL ANALYSIS – Prices continue to consolidate above two-month support after failing to hold up above the $1200/oz figure. A break below the 1170.30-86 area (May 1 low, 50% Fibonacci expansion) exposes the 61.8% level at 1162.64. Alternatively, a move above the 38.2% Fib at 1179.07 targets the 23.6% expansion at 1189.24.

CRUDE OIL TECHNICAL ANALYSIS – Prices broke support at a rising trend line capping losses since mid-January, hinting the longer-term down trend may be resuming. A break below the 60.27-61.37 area (38.2% Fibonacci retracement, April 22 low) exposes the 50% level at 57.39. Alternatively, a move back above the trend line – now at 63.70 – targets the 23.6% Fib expansion at 66.69.

--- Written by Ilya Spivak, Currency Strategist for DailyFX.com
To receive Ilya's analysis directly via email, please SIGN UP HERE
Contact and follow Ilya on Twitter: @IlyaSpivak
DailyFX provides forex news and technical analysis on the trends that influence the global currency markets.
Learn forex trading with a free practice account and trading charts from FXCM.
