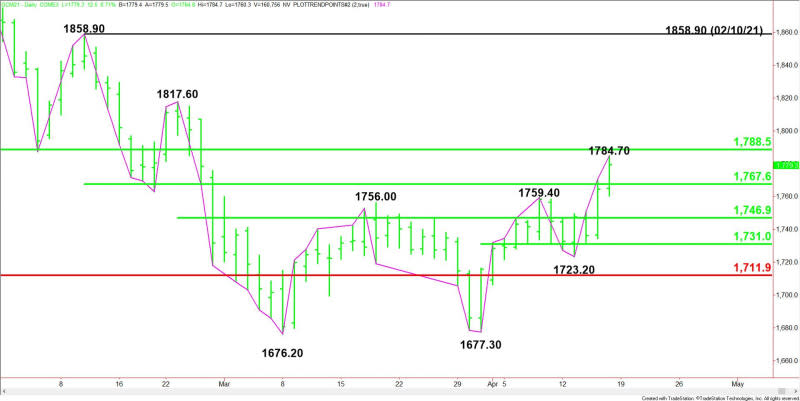
Gold Price Futures (GC) Technical Analysis – Trader Reaction to $1788.50 Determines Near-Term Tone
Gold futures hit their highest level since February 25 on Friday, putting them in a position to post their best weekly performance since mid-December as a pullback in U.S. Treasury yields pressured the U.S. Dollar, lifting demand for the dollar-denominated commodity.
At 18:09 GMT, June Comex gold futures are trading $1779.10, down $12.30 or +0.70%.
Gold traders have put their faith in the Federal Reserve’s pledge to keep interest rates at historically low levels until the economy makes a full recovery. Even if inflation does jump above 2% and holds there for several weeks or months, the Fed promises it has the tools to keep it from getting out of control.

Daily Swing Chart Technical Analysis
The main trend is up according to the daily swing chart. A late session trade through the intraday high at $1784.70 will signal a resumption of the uptrend. The main trend will change to down on a move through the nearest swing bottom at $1723.20.
Gold is currently trading within striking distance of a long-term 50% level at $1788.50. This level is potential resistance, but also the trigger point for an acceleration to the upside.
The first support is a 50% level at $1767.60, followed by additional 50% support levels at $1746.90 and $1731.00.
The major support is the long-term Fibonacci level at $1711.90.
Short-Term Outlook
The next major move in gold will be determined by trader reaction to the major 50% level at $1788.50.
Bullish Scenario
A sustained move over $1788.50 will indicate the presence of buyers. If this move creates enough upside momentum then look for the rally to possibly extend into the main top at $1817.60 over the near-term. This is the last potential resistance level before the February 10 main top at $1858.90.
Bearish Scenario
A sustained move under $1788.50 will signal the presence of sellers. This could lead to a stair-step correction with potential support levels coming in at $1767.60, $1746.90 and $1731.00. Since the main trend is up, the best value level is $1731.00.
For a look at all of today’s economic events, check out our economic calendar.
This article was originally posted on FX Empire
More From FXEMPIRE:
Natural Gas Price Forecast – Natural Gas Rallies Into the Weekend
Crude Oil Weekly Price Forecast – Crude Oil Markets Have Strong Week
Russia: US Sanctions On Sovereign Debt Signal Rising Risk Surrounding Geopolitical Tensions
NZD/USD Forex Technical Analysis – Rally Stopped Short of .7204 to .7266 Resistance Zone

 Yahoo Finance