
 Yahoo Finance
 Gold Price Futures (GC) Technical Analysis – Straddling Short-Term Retracement Zone at $1342.90 to $1338.40
Gold prices are treading water on Monday as investors position themselves ahead of the start of the two-day Federal Reserve meeting on Tuesday and the central bank’s interest rate and monetary policy decisions on Wednesday.
The market was pressured from the opening on Monday as traders continued to respond to Friday’s stronger-than-expected U.S. retail sales data, which trimmed the chances of a June Fed rate cut. Gold bounced back shortly after the U.S. opening after the Empire State Manufacturing Index report came in well below expectations. Since then the price action has been sideways-to-slightly higher.
At 18:42 GMT, August Comex gold futures are trading $1342.30, down $2.30 or -0.16%.
Daily Swing Chart Technical Analysis
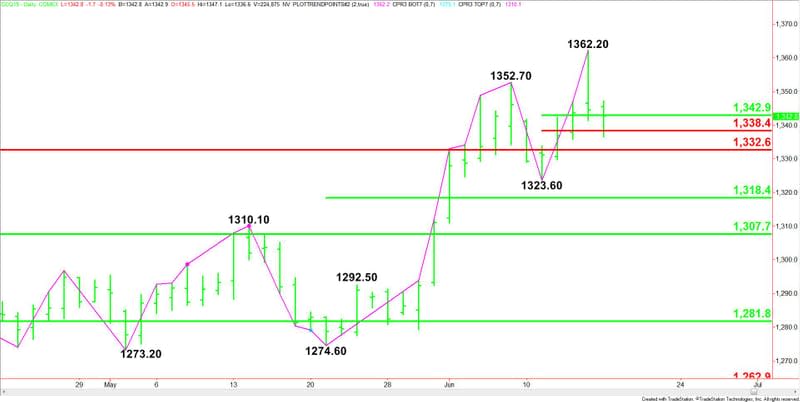
The main trend is up according to the daily swing chart. However, momentum shifted to the downside with the formation of the closing price reversal top on Friday and the subsequent confirmation early in the session on Monday.
A trade through $1362.20 will negate the closing price reversal top and signal a resumption of the uptrend. A move through $1323.60 will change the main trend to down.
The short-term range is $1323.60 to $1362.20. Gold is currently straddling its retracement zone at $1342.90 to $1338.40.
The main range is $1274.60 to $1362.20. If the trend changes to down then look for a pullback into its retracement zone at $1318.40 to $1307.70.
A long-term Fibonacci level at $1332.60 is also potential support at $1332.60.
Daily Swing Chart Technical Forecast
Based on the current price at $1342.30, the direction of the August Comex gold futures contract into the extended close is likely to be determined by trader reaction to the short-term 50% level at $1342.90.
Bullish Scenario
A sustained move over $1342.90 into the close will indicate the presence of buyers. The short-term pivot target is $1349.40. Overcoming this level will indicate the buying is getting stronger with $1362.20 the next target.
Bearish Scenario
A sustained move under $1342.90 into the close will signal the presence of sellers. The first target is the short-term Fibonacci level at $1338.40. This is followed by the long-term Fibonacci level at $1332.60, followed by the $1323.60 main bottom.
This article was originally posted on FX Empire
