
 Yahoo Finance
 Gold Price Futures (GC) Technical Analysis – Another $20 to Downside if $1268.90 Fails as Support
Gold futures are under pressure on Wednesday, driven lower by stronger-than-expected economic data from China and the U.S. Rising Treasury yields are also making the U.S. Dollar a more attractive investment which is weighing on demand for dollar-denominated gold. Perhaps helping to limited losses is a mixed performance in the U.S. equity markets.
At 14:41 GMT, June Comex gold is trading $1276.30, down $0.90 or -0.08%.
Daily Technical Analysis
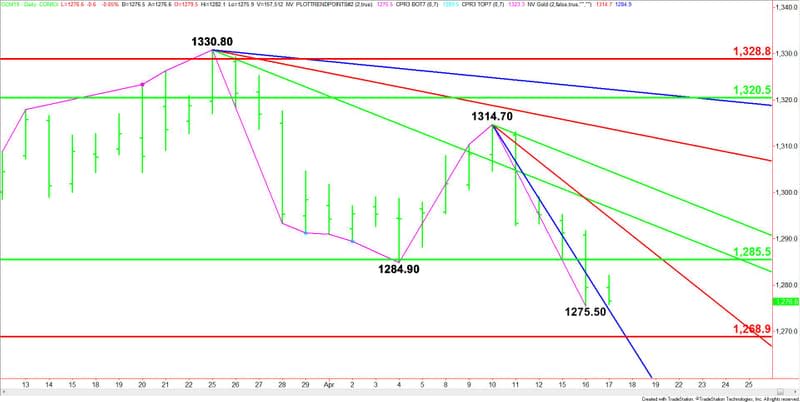
The main trend is down according to the daily swing chart. A trade through $1275.50 will signal a resumption of the downtrend. The next main bottom comes in at $1249.00. The main trend changes to up on a trade through $1314.70. This is not likely to occur unless a closing price reversal bottom forms later today.
The major support is a retracement zone at $1285.50 to $1268.90. This zone is controlling the longer-term direction of the market.
Daily Technical Forecast
Based on the early price action, the direction of the June Comex gold market the rest of the session is likely to be determined by trader reaction to the steep downtrending Gann angle at $1274.70.
Bullish Scenario
Holding above $1274.40 will indicate the presence of buyers. Turning higher for the day will indicate the buying is getting stronger. This could trigger a rally into the major 50% level at $1285.50, followed by a downtrending Gann angle at $1284.70.
Bearish Scenario
A sustained move under $1274.40 will put gold in a bearish position. This could trigger a break into the Fibonacci level at $1268.90. Look out to the downside if $1268.90 fails as support. The next major downside target comes in at $1249.00.
This article was originally posted on FX Empire
More From FXEMPIRE:
Natural Gas Price Forecast – Natural gas markets fall on Wednesday
AUD/USD Price Forecast – Australian dollar continues to grind higher
Gold Price Prediction – Gold Continues to Slip, as Negative Momentum Accelerates
Forex Daily Recap – USD/CNY Marked the Month’s Lowest Vicinity Following Solid Chinese Data
E-mini Dow Jones Industrial Average (YM) Futures Technical Analysis – April 17, 2019 Forecast
