Gold Price: Continuing to Ride Trend-Line Support
DailyFX.com -
To receive James Stanley’s Analysis directly via email, please sign up here.
Talking Points:
Gold Technical Strategy: Flat
Gold continues to trade with a bearish posture, but lack of nearby resistance leaves few setups to the short-side
$1,100 offered key support last week; breaks of last week’s low could provide short-side breakout entry potential.
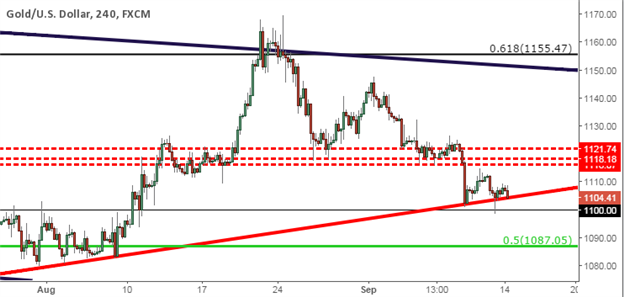
Gold continues to face selling pressure, extending the down-trend that kicked off on August 24th as weakness from Asia began to show more prominently throughout the global financial community. Since then, we’ve seen Gold fall from $1,169 to last week’s low of $1,098.66. The low of last week was fleeting, as we had a quick break of the $1,100 psychological level only for buyers to take control and push prices back up to $1,109.
From here, a daily close below the $1,100 psychological level opens the door for a test of the 50% Fibonacci retracement of the ‘big picture’ move (from the 1999 low to the 2011 high) at 1087.05. Alternatively, a move back above the 61.8% Fibonacci retracement of the secondary trend (from the 2008 low to the 2011 high) at $1,155.47 negates the bearish posture, and could open the door for bullish opportunities.
For short positions, traders can look for the break of $1,100 support; or alternatively can wait for resistance to show on a shorter-time frame in the vicinity of prior support. Resistance at 1116.07, 1118.18, or 1121.74 could all serve this purpose, as gold caught short-term support at each of these intervals before breaking lower.

--- Written by James Stanley, Analyst for DailyFX.com
To receive James Stanley’s analysis directly via email, please SIGN UP HERE
Contact and follow James on Twitter: @JStanleyFX
DailyFX provides forex news and technical analysis on the trends that influence the global currency markets.
Learn forex trading with a free practice account and trading charts from FXCM.

 Yahoo Finance
