
 Yahoo Finance
 Gold May Be Readying to Turn Lower Anew, SPX 500 Stalling at Support
DailyFX.com -
Talking Points:
US Dollar Continues to Tread Water at February Low
S&P 500 Stalls After Sliding to Two-Month Support
Gold Prices May Be Readying to Decline Once Again
Can’t access the Dow Jones FXCM US Dollar Index? Try the USD basket on Mirror Trader. **
US DOLLAR TECHNICAL ANALYSIS – Prices turned lower as expected, with prices digesting losses near monthly lows. A daily close below the 11858-86 area (23.6% Fibonacci retracement, March 18 low) exposes the 38.2% level at 11679. Alternatively, a reversal back above the 14.6% Fib expansion at 12066 clears the way for a test of the 12149-77 zone (23.6% threshold, March 13 high).
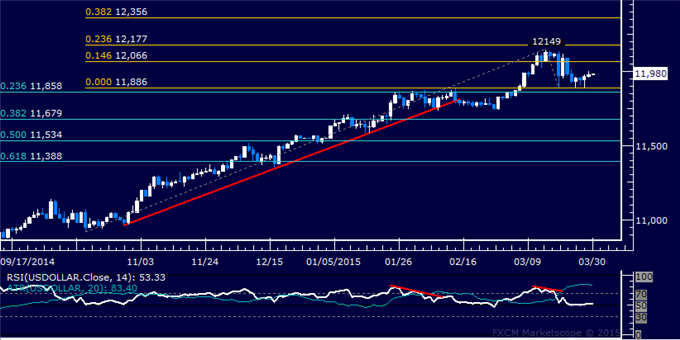
Daily Chart - Created Using FXCM Marketscope
** The Dow Jones FXCM US Dollar Index and the Mirror Trader USD basket are not the same product.
S&P 500 TECHNICAL ANALYSIS – Prices declined as expected after putting in a bearish Evening Star candlestick pattern below February’s swing high. A daily close belowchannel floor support at 2060.50 exposes the March 12 low at 2040.10. Alternatively, a reversal above the 14.6% Fibonacci expansion at 2084.00 targets the 2111.00-19.40 area (23.6% level, February 25 high).
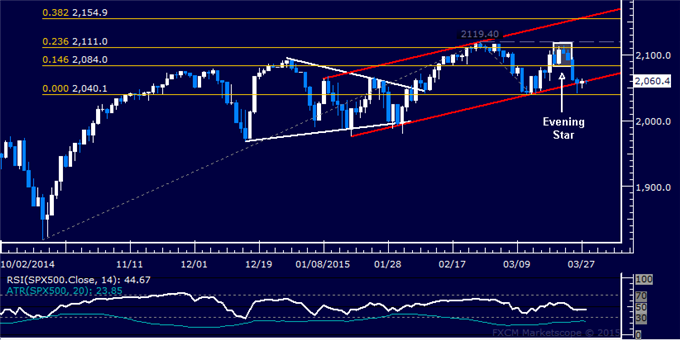
Daily Chart - Created Using FXCM Marketscope
GOLD TECHNICAL ANALYSIS – Prices may be preparing to turn lower after putting in a bearish Dark Cloud Cover candlestick pattern. A daily close below the 23.6% Fibonacci retracement at 1181.51 exposes the 14.6% level at 1166.67. Alternatively, a reversal above the 38.2% Fib at 1205.58 targets the 50% retracement at 1225.04.
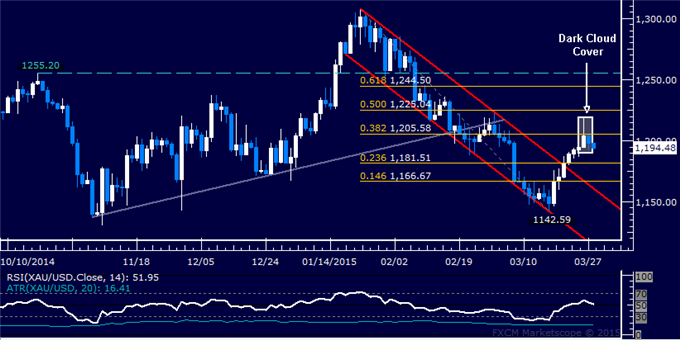
Daily Chart - Created Using FXCM Marketscope
CRUDE OIL TECHNICAL ANALYSIS – Prices reversed sharply lower after finding resistance below the $60/barrel figure. A break below the 38.2% Fibonacci expansion at 55.77 exposes the 50% level at 54.53. Alternatively, a reversal above the March 26 high at 59.75 targets the February 17 high at 62.98.
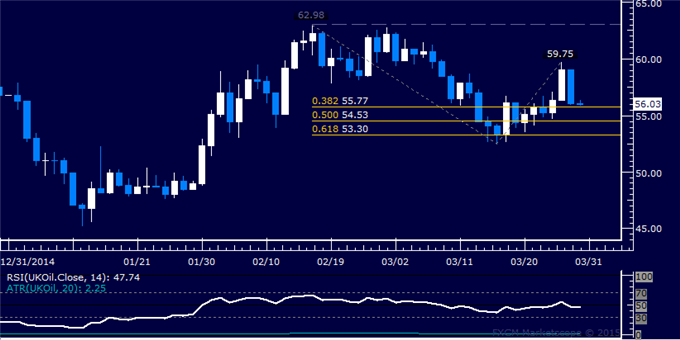
Daily Chart - Created Using FXCM Marketscope
--- Written by Ilya Spivak, Currency Strategist for DailyFX.com
To receive Ilya's analysis directly via email, please SIGN UP HERE
Contact and follow Ilya on Twitter: @IlyaSpivak
DailyFX provides forex news and technical analysis on the trends that influence the global currency markets.
Learn forex trading with a free practice account and trading charts from FXCM.
