Gold and Bitcoin Sell Off as Dovish Pivot Evaporates
Throughout 2023, assets like gold and bitcoin have provided a valuable gauge of how investors are pricing in the prospects of future rate hikes. Gold, as a non-yield-bearing safe haven, can experience weakness when the economy is strong and interest rates are high.
Bitcoin, which serves a slightly more complex role as part risk asset, part haven, is also sensitive to interest rates, but is often also correlated to the performance of the US tech sector.
Gold & Bitcoin Fail to Hold Key Support Levels
The recent sell-off in these two symbols poses some questions about whether the broader market is gradually coming to terms with an interest rate environment that is likely to be higher for longer.
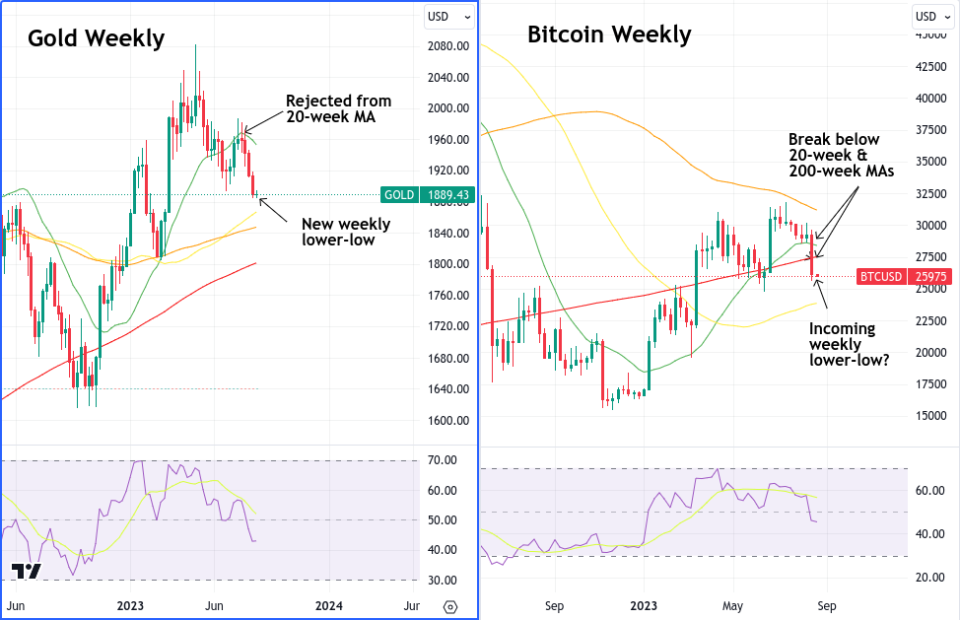
This is particularly important now as the selling, which began at the end of July for gold and in mid-August for bitcoin, has caused both gold and bitcoin to set new daily lower-lows, the prices of both assets having also plunged below their respective 200-day moving averages.

On the weekly timeframe, gold has now also set a new weekly lower-low in relation to its June weekly low at $1906. Currently trading at $1887, it has also broken below the important psychological support level of $1900.
Meanwhile, bitcoin’s own 10% rout, which commenced in earnest on August 17, saw the number one cryptocurrency taking out both its 100-day and 200-day moving averages on the same day to trade at around $26k. At the time of writing, bitcoin has yet to set a weekly lower-low of its own, but the bears still have an entire week of trading and only about $100 between the current price and bitcoin’s June low to go.
Perhaps more importantly, on the week ending August 20th, bitcoin also broke below both its 20-week and 200-week moving averages. The 20-week has traditionally been the gauge of whether bitcoin is in a bull or bear market, with the 200-week tending to represent the extremes of bearish activity.
How We Got Here
Both gold and bitcoin have performed well in 2023, despite a macroeconomic climate that ought to have provided significant headwinds for both. Both entered 2023 with some momentum. Having experienced sharp declines throughout 2022 as markets came to terms with the Fed’s commitment to raising rates, they rallied after appearing to have bottomed-out towards the end of the year (September to November for gold, November to January for bitcoin). This was a wider phenomenon, with markets entering 2023 with the belief that the Fed was closer to the end of its tightening than to the start.
When you look at the charts of the S&P 500 and Nasdaq 100 you can see this same broad trend. A bottoming in late 2022 at or below their respective 200-week moving averages, followed by a trend change and subsequent series of higher-highs and higher-lows into the first half of 2023.
What Changed?
The difference between gold, bitcoin, and US equities is that the rally appears to stall around March/April of 2023 in the case of gold and bitcoin, whereas in the case of US equities it continues on until August.
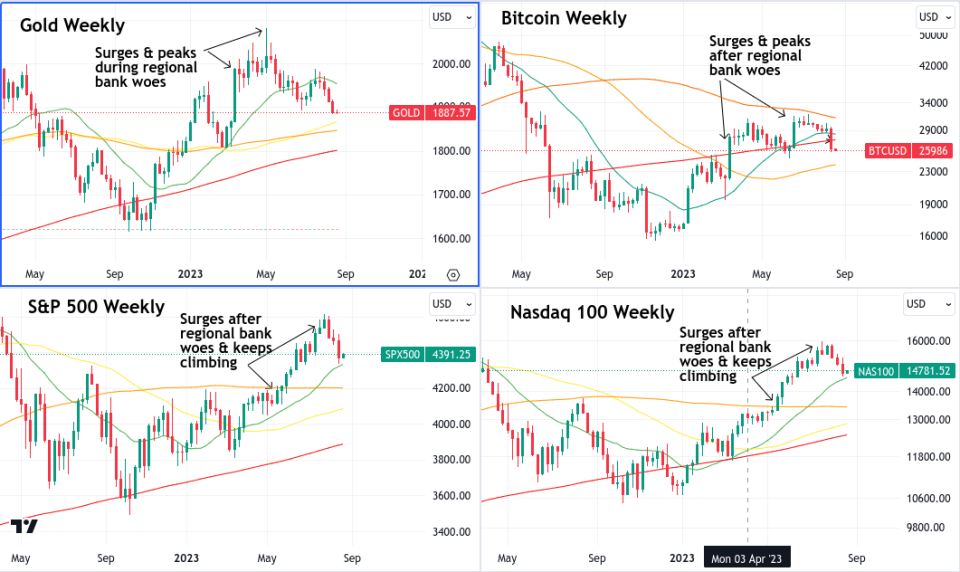
Gold peaked in May and has subsequently failed to reclaim that level. Bitcoin peaked in April at around $30k, consolidated, then managed to rally marginally higher than its April peak in June before the bears returned in the manner outlined above.
Both of these peaks came after the US regional banking turmoil that initially had markets thinking the Federal Reserve’s rate-hiking days were over. When that turmoil was contained, and the Fed resumed its fight against inflation, it appears that these markets (gold first, then bitcoin) got the message sooner.
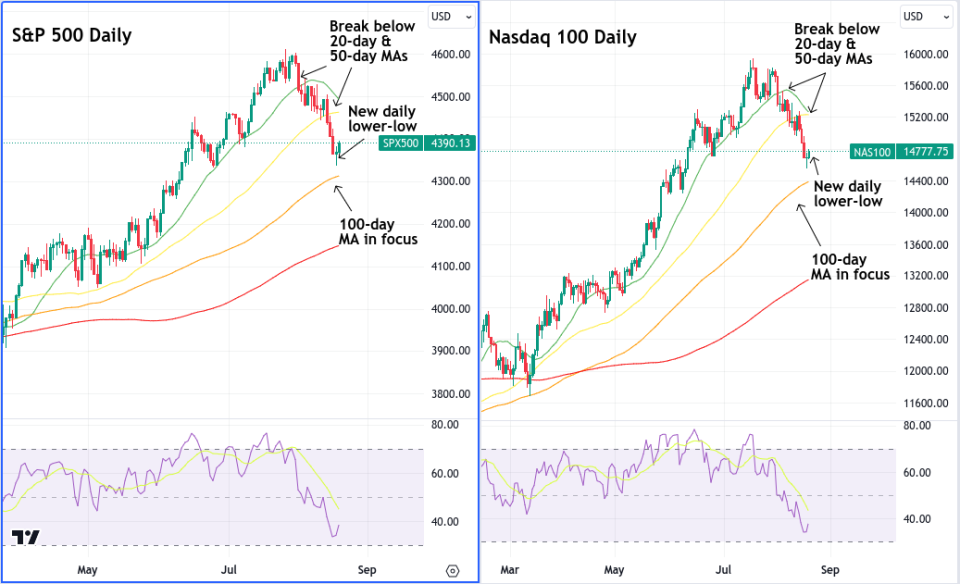
US stocks, which have been buoyed all year by a handful of tech stocks and the AI narrative, continued making new highs until recently. As things currently stand, both the S&P 500 and Nasdaq have yet to set weekly lower-lows or break below their August 2022 highs. Both have set daily lower-lows over the past week or so, having broken below their respective 20-day and 50-day moving averages. Both are currently moving to test their respective 100-day moving averages.
Jackson Hole in Focus
Later this week, the eyes and ears of market participants will turn to the Kansas City Fed’s Jackson Hole symposium in Wyoming for any further clues as to the Fed’s path ahead regarding US interest rates.
September has tended, historically, to be on average the worst performing month of the year across all three major US indices. With gold and bitcoin having been signalling bearish since they peaked earlier this year, could we see US equities follow suit if market participants don’t receive at least some reasons to hope for a pause or dovish pivot?
The CFDs on gold, bitcoin, the US equities, and other instruments are available for trading at HYCM.
Note: Cryptocurrencies are not available for trading under HYCM (Europe) Ltd and HYCM Capital Markets (UK) Limited.
About: HYCM is the global brand name of HYCM Capital Markets (UK) Limited, HYCM (Europe) Ltd, HYCM Capital Markets (DIFC) Ltd, HYCM Ltd, and HYCM Limited, all individual entities under HYCM Capital Markets Group, a global corporation operating in Asia, Europe, and the Middle East.
High-Risk Investment Warning: Contracts for Difference (‘CFDs’) are complex financial products that are traded on margin. Trading CFDs carries a high degree of risk. It is possible to lose all your capital. These products may not be suitable for everyone, and you should ensure that you understand the risks involved. Seek independent expert advice if necessary and speculate only with funds that you can afford to lose. Please think carefully whether such trading suits you, taking into consideration all the relevant circumstances, as well as your personal resources. We do not recommend clients posting their entire account balance to meet margin requirements. Clients can minimise their level of exposure by requesting a change in leverage limit. For more information, please refer to HYCM’s Risk Disclosure.
*Any opinions made in this material are personal to the author and do not reflect the opinion of HYCM. This material is considered a marketing communication and should not be construed as containing investment advice or an investment recommendation, or an offer of or solicitation for any transactions in financial instruments. Past performance is not a guarantee of or prediction of future performance. HYCM does not take into account your personal investment objectives or financial situation. HYCM makes no representation and assumes no liability as to the accuracy or completeness of the information provided, nor any loss arising from any investment based on a recommendation, forecast, or other information supplied by an employee of HYCM, a third party, or otherwise.
This article was originally posted on FX Empire