
 Yahoo Finance
 GCM Mining Announces Updated Mineral Resource Estimate and Positive Preliminary Economic Assessment for Its Toroparu Project in Guyana
Figures 1 & 2
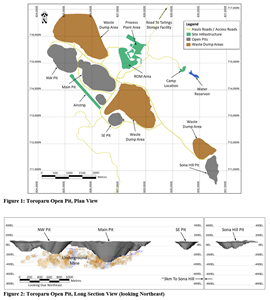
Figure 1: Toroparu Open Pit, Plan View; Figure 2: Toroparu Open Pit, Long Section View (looking Northeast)
Figure 3
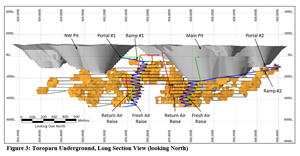
Figure 3: Toroparu Underground, Long Section View (looking North)
Updated Mineral Resource Estimate of 8.4 Mozs Measured and Indicated Gold Resource at 1.42 g/t and 396 Mlbs Measured and Indicated Copper Resource at 0.1% in 185 million tonnes of rock
Preliminary Economic Assessment estimates:
280,000 ozs of gold production in the first year of operation in 2024;
5.4 Mozs of gold, 2.5 Mozs of silver and 141.3 Mlbs of copper produced over a 24-year mine life;
US$8.0 billion total revenue, US$3.5 billion operating margin and US$1.7 billion after-tax Free Cash Flow at a US$1,500/oz gold price; and,
After-tax net present value (5%) of US$794 million with an after-tax IRR of 46% and two-year payback.
Initial US$355 Million capex to construct the Toroparu Project is fully funded.
TORONTO, Dec. 01, 2021 (GLOBE NEWSWIRE) -- GCM Mining Corp. (the “Company”) (TSX: GCM, OTCQX: TPRFF) announced today that it has completed an updated Mineral Resource estimate for its Toroparu Project in Guyana with an effective date of November 1, 2021 and in accordance with the Canadian Institute of Mining Metallurgy and Petroleum (“CIM”) Definition Standards incorporated by reference in National Instrument 43-101 – Standards of Disclosure for Mineral Projects (“NI 43-101”). GCM Mining also announced today that Nordmin Engineering Ltd. (“Nordmin”) and SRK Consulting (U.S.), Inc. (“SRK”) have completed preliminary results of a Preliminary Economic Assessment (“PEA”) for the Toroparu Project effective November 26, 2021 and is currently finalizing the technical report to be prepared in accordance with NI 43-101 and filed on SEDAR and the Company’s website in mid-January 2022.
Highlights of the PEA for the Toroparu Project
The PEA affirms the economic viability of the open pit and underground mining operations at the Toroparu Project.
Total life-of-mine (“LoM”) gold production of 5.4 million ounces (“Mozs”) representing 88.4% of the 6.2 Mozs of gold fed to the milling circuit at an average grade of 1.78 g/t Au over the 24-year mine life.
Open pit mine operations will deliver 93 Mt of potential mill feed (“PMF”) over the LoM and underground mining operations, which commence in year 10, will deliver an additional 14 Mt of PMF.
Average annual gold production of 225,000 ounces over the 24-year mine life. During the first two-year payback period, gold production averages 254,000 ounces per year and over the first 9 years of surface-only mining, gold production averages 202,000 ounces per year. With the commencement of underground mining in year 10, annual gold production from open pit and underground increases to an average of 239,000 ounces over the remaining 15 years of the LoM.
Initial capital cost, to be incurred from 2021 through 2023, totals US$355 million, of which US$138 million will be funded by deposits under a Precious Metals Purchase Agreement (“PMPA”) with Wheaton Precious Metals International Ltd. (“WPMI”) and the balance by the net proceeds of the Senior Notes financing closed in August of this year.
Processing capacity will be built in two phases with an initial Phase I nominal capacity of 7,000 tpd (2.55 Mtpa) in a gold leach plant based on gravity and carbon-in-leach circuits (“CIL”) and increasing in year 6 to 14,000 tpd (5.1 Mtpa) in Phase II with the construction of a copper concentrator based on gravity and copper flotation circuits. The copper concentrator will facilitate the recovery of 141.3 million pounds (“Mlbs”) of copper over its 19 years of operation.
The PEA delivers solid financial results with LoM total revenue of US$8.0 billion, US$3.5 billion of operating margin and US$1.7 billion of after-tax Free Cash Flow. The LoM PEA financial results are based on long-term prices of US$1,500/oz gold, US$20.22/oz silver and US$3.13/lb copper.
Gold and copper account for approximately 94% and 5.5%, respectively, of total revenue over the LoM.
LoM cash cost of US$742/oz and LoM all-in sustaining cost (“AISC”) of US$916/oz.
The PEA estimates a US$794 million after-tax NPV 5% (net present value at a 5% discount rate), a 46% IRR (after-tax Internal Rate of Return) and a two-year after-tax payback of the initial capital cost of the Project.
Lombardo Paredes, Chief Executive Officer of GCM Mining, commented “The PEA was initiated as a result of a significantly expanded Mineral Resource developed from the discovery of the structural control of high-grade gold mineralization at Toroparu as reported in our July 6, 2021 press release. Compared with Gold X Mining’s previous Mineral Resource estimate (September 2018), total Measured and Indicated Gold Resources have increased by approximately 15% to 8.4 million ounces of gold and reflect an increase in the average head grade from 0.91 g/t to 1.42 g/t in the latest update. The updated mineral resource estimate reported herein, which represents a potential step change to the economic value of Toroparu, underlies the scoping of a long mine life project within the PEA recovering 280,000 ounces of gold in the first year of operation in 2024 and an estimated 225,000 ounces of gold per year from both surface and underground mining operations over 24 years. A total of 5.4 million ounces of gold is expected to be produced over the LoM in the PEA, an approximately 20% increase from the previous PEA prepared by Gold X Mining in July 2019. We have already commenced pre-construction activities at the Toroparu Project site. We have hired Haukes Construction (Guyana) Ltd., a division of Haukes NV of Suriname, for construction of the preliminary earthworks at Toroparu, with development of the permanent man-camp, airstrip and rock quarries currently underway. Preparations are also being made for the rehabilitation of the historical access road commencing early next year. Based on the technical and financial merits demonstrated by the PEA and funded by the US$300 million Senior Notes financing we closed in August and the Wheaton stream, we are proceeding with construction of the Toroparu Project, which is initially focused on the surface mining of higher-grade gold processed through a 7,000 tonnes per day (“tpd”) gold leach mill. The PEA envisions an expansion of milling capacity to 14,000 tpd with the addition of a copper concentrator in year 6 and the addition of underground mining operations in year 10 of the mine life. Importantly, the Toroparu Deposit is open both along strike and at depth with the additional mineralization potential below the 450 m level amenable to underground mining methods. We believe the Toroparu Project has the potential to be a multi-generational gold mine which can create significant value for our shareholders, solidifying its position along with our Segovia Operations as a cornerstone asset in GCM Mining.”
Mineral Resource Estimate (“MRE”) Update Effective November 1, 2021
The MRE, which is summarized in Tables 1 and 2 below, was prepared by Nordmin following a two-phase diamond drill program carried out by Gold X Mining in 2020-2021 which comprised a total of 20,750 meters in 114 drill holes. The updated MRE includes an open pit and a maiden underground resource estimate within the Toroparu Main & NW and SE deposits that are defined by multiple discreet northwest and east-west oriented high grade mineralized structures that intersect in a repeatable pattern over an estimated four kilometers of strike, 400-450 m in width, and 450-500 m in depth. The satellite deposits consist of the Southeast zone (SE) and the Sona Hill satellite gold deposits.
Table 1: Mineral Resource Statement for the Toroparu Gold Project
Deposit | Area | Type | Resource | Tonnes | Au | Au (oz) | Cu | Cu (lb) | Ag | Ag (oz) |
Toroparu | Main & NW | Open Pit | Measured | 98,070,291 | 1.21 | 3,809,178 | 0.110 | 238,111,611 | 1.19 | 3,742,659 |
Toroparu | Main & NW | Open Pit | Indicated | 62,531,387 | 1.56 | 3,132,509 | 0.100 | 137,556,947 | 0.91 | 1,828,430 |
Toroparu | Southeast | Open Pit | Measured | 5,121,448 | 1.16 | 190,285 | 0.043 | 4,825,694 | - | - |
Toroparu | Southeast | Open Pit | Indicated | 2,403,013 | 1.14 | 88,391 | 0.052 | 2,762,872 | - | - |
Sona Hill | Sona Hill | Open Pit | Measured | 6,958,156 | 1.85 | 413,224 | 0.008 | 1,241,377 | 1.07 | 238,790 |
Sona Hill | Sona Hill | Open Pit | Indicated | 4,179,989 | 1.66 | 223,062 | 0.008 | 699,784 | 0.85 | 114,530 |
Toroparu | Main & NW & SE | Underground | Measured | 727,497 | 2.84 | 66,476 | 0.072 | 1,150,934 | 0.47 | 11,100 |
Toroparu | Main & NW & SE | Underground | Indicated | 4,977,604 | 3.21 | 513,914 | 0.091 | 9,937,252 | 0.41 | 66,013 |
Subtotal: Measured | 110,877,392 | 1.26 | 4,479,163 | 0.100 | 245,329,616 | 1.12 | 3,992,550 | |||
Subtotal: Indicated | 74,091,993 | 1.66 | 3,957,875 | 0.092 | 150,956,854 | 0.84 | 2,008,972 | |||
Subtotal: Measured & Indicated | 184,969,385 | 1.42 | 8,437,039 | 0.097 | 396,286,470 | 1.01 | 6,001,522 | |||
Toroparu | Main & NW | Open Pit | Inferred | 4,018,483 | 1.58 | 203,693 | 0.080 | 7,117,507 | 0.66 | 84,986 |
Toroparu | Southeast | Open Pit | Inferred | 9,411 | 1.67 | 505 | 0.040 | 8,348 | - | - |
Sona Hill | Sona Hill | Open Pit | Inferred | 1,365,019 | 1.28 | 56,275 | 0.006 | 178,861 | 0.54 | 23,789 |
Toroparu | Main & NW & SE | Underground | Inferred | 8,402,611 | 3.53 | 952,845 | 0.091 | 16,884,424 | 0.25 | 68,259 |
Subtotal: Inferred | 13,795,524 | 2.74 | 1,213,317 | 0.080 | 24,189,139 | 0.40 | 177,035 | |||
Total | 198,764,909 | 1.51 | 9,650,356 | 0.006 | 27,972,610 | 0.97 | 6,178,557 | |||
Table 2: Mineral Resource Estimate Summary
Tonnes | Au (g/t) | Au (oz) | Cu (%) | Cu (lb) | Ag (g/t) | Ag (oz) | |
Open Pit | |||||||
Measured and Indicated | 179,264,284 | 1.36 | 7,856,649 | 0.097 | 385,198,283 | 1.03 | 5,924,409 |
Inferred | 5,392,913 | 1.50 | 260,473 | 0.061 | 7,304,715 | 0.63 | 108,776 |
Underground | |||||||
Measured and Indicated | 5,705,101 | 3.16 | 580,390 | 0.088 | 11,088,186 | 0.42 | 77,113 |
Inferred | 8,402,611 | 3.53 | 952,845 | 0.091 | 16,884,424 | 0.25 | 68,259 |
Total | |||||||
Measured and Indicated | 184,969,385 | 1.42 | 8,437,039 | 0.097 | 396,286,470 | 1.01 | 6,001,522 |
Inferred | 13,795,524 | 2.74 | 1,213,317 | 0.080 | 24,189,139 | 0.40 | 177,035 |
Combined Open Pit and Underground Mineral Resources; the Open Pit Mineral Resource is based on a 0.40 g/t gold cut-off grade, and the Underground Mineral Resource is based on 1.80 g/t gold cut-off grade.
Mineral Resource Estimate Notes
Combined Open Pit and Underground Mineral Resources were prepared in accordance with NI 43-101 and the CIM Definition Standards for Mineral Resources and Mineral Reserves (2014) and the CIM Estimation of Mineral Resources and Mineral Reserves Best Practice Guidelines (2019). Mineral Resources that are not Mineral Reserves do not have demonstrated economic viability. This estimate of Mineral Resources may be materially affected by environmental, permitting, legal, title, taxation, socio-political, marketing, or other relevant issues.
Underground and Open Pit Mineral Resources are based on a gold price of US$1,630/oz. This gold price is the three-year trailing average as of September 30, 2021.
Open Pit Mineral Resources comprise the material contained within various Lerchs-Grossmann pit shells at various revenue factors. These revenue factors are as follows: Main/Southeast/NW Zone @ 0.75 revenue factor and Sona Hill @ 1.00 revenue factor. The gold cut-off applied to Open Pit Mineral Resources within the selected pit shells was 0.40 g/t.
Underground Mineral Resources comprise all material found within Mineable Shape Optimizer (“MSO”) wireframes generated at a cut-off of 1.80 g/t gold including material below cut-off.
Ag values are not reported for the Southeast Open Pit Ag contained metal values reported will not equal A tonnes X grade conversion calculation.
Assays were variably capped on a wireframe-by-wireframe basis.
Specific gravity was applied using weighted averages to each individual litho type.
Mineral Resource effective date November 1, 2021.
All figures are rounded to reflect the relative accuracy of the estimates and totals may not add correctly.
Excludes unclassified mineralization located within mined out areas.
Reported from within a mineralization envelope accounting for mineral continuity.
The Mineral Resource Statement presented in Tables 1 and 2, was prepared by Independent Qualified Person (“QP”), Glen Kuntz, P. Geo. of Nordmin with the head office located in Thunder Bay, Ontario. The MRE is based on validated results of 528 surface drill holes totaling 178,491 m of diamond drilling for the Toroparu Deposit, representing a 19.7% increase over the previous MRE conducted in 2018, and 181 surface drill holes totaling 20,850 m for the Sona Hill Deposit that was completed between January 2006 and the effective date of November 1, 2021. The Mineral Resource Statement includes 72 surface drill holes totaling 10,166 m of diamond drilling conducted by Gold X Mining in the fourth quarter of 2020 together with an additional 73,439 gold (“Au”) assays, 70,628 copper (“Cu”) assays, and 35,054 silver (“Ag”) assays that were not included in the previous Mineral Resource update completed in 2018.
The MRE, which is effective from November 1, 2021, supersedes all previous MREs and Technical Reports filed by Gold X Mining Ltd. and Sandspring Resources Ltd. The MRE was optimized from previous estimates which defined resources contained in a lower grade bulk tonnage geologic model. The updated understanding of the geologic structural control over gold mineralization defines a lower volume, higher-grade core resource that can be mined using both open pit and underground mining methods. Further, the Phase 2 drill results indicate the scale of the mineralization that remains open to the northwest and at depth below 450-500 metres.
Toroparu PEA and LoM Plan
A mining study and schedule was prepared by the technical professionals at SRK and Nordmin to create a LoM production schedule for the Toroparu Project that will initially comprise open pit mine operations and ultimately expand in year 10 to include underground mine operations. Sustaining capital expenditures related to the development of the underground mining areas will commence in year 9 (2032).
The PEA also envisions a two-phase investment in processing facilities with an initial 7,000 tpd (2.55 Mtpa) Phase I nominal capacity in a gold leach plant based on gravity and CIL. Construction of a copper concentrator in years 4 and 5 (2027-2028) at a capital cost of approximately US$103 million (included in sustaining capital expenditures and AISC data) will increase Phase II nominal capacity to 14,000 tpd (5.1 Mtpa) by Year 6 (2029) of the LoM. The copper concentrator will be based on gravity and copper flotation circuits and will facilitate the recovery of 141.3 Mlbs of copper over its 19 years of operation.
The PEA LoM production schedule foresees a total of 107.3 million tonnes of mineralized material being processed over a 24-year mine life resulting in a total of 5.4 million ounces of gold produced at an average LoM total cash cost of US$742 per ounce and an average LoM AISC of US$916 per ounce. The initial capital cost, to be incurred between 2021 and 2023, is estimated to total US$355 million. At an expected long-term gold price of US$1,500 per ounce, total LoM undiscounted after-tax project cash flow from mining operations amounts to US$1.7 billion. At a 5% discount rate, the net present value of the total LoM after-tax project cash flow amounts to US$794 million. Before financing, the project has a 46% after-tax internal rate of return and payback of approximately two years.
A summary of the key estimated LoM production data in the PEA is summarized as follows:
Life of Mine | 24 years |
Processing Rate - Phase I | 7,000 tpd / 2.6 Mtpa |
Processing Rate - Phase II (starting in yr 6) | 14,000 tpd / 5.1 Mtpa |
Recovered Gold | 5.4 Mozs |
Recovered Silver | 2.5 Mozs |
Recovered copper | 141.3 Mlbs |
Average Gold Recovery | 88.4% |
Pre-production Mined Tonnage | 17.1 Mt |
Total Mined Tonnage (including pre-production) from Open Pit | 665 Mt |
Total Milled Tonnage from Open Pit | 93.1 Mt |
Open Pit Strip Ratio (waste: ore) | 6:1 |
Total Mined & Milled Tonnage from Underground | 14.2 Mt |
Total Milled Tonnage | 107.3 Mt |
Average Annual Gold Production | 225 Kozs |
Average Mill Feed Grade - Gold | 1.78 g/t |
A summary of the key operating and financial metrics over the 24-year mine life in the PEA is as follows;
Period | Gold | Revenue | Opex | Royalties | Income | Working | Operating | Sustaining | Free | Initial | Project | Cash | AISC | |||||||||||||
kozs | US$ Millions | US$/oz | ||||||||||||||||||||||||
2021 (2) | - | - | - | 0 | 0 | 0 | 0 | - | - | (3 | ) | (3 | ) | - | - | |||||||||||
2022 | - | - | - | 0 | 0 | 0 | 0 | - | - | (78 | ) | (78 | ) | - | - | |||||||||||
2023 | - | - | - | 0 | 0 | 0 | 0 | - | - | (135 | ) | (135 | ) | - | - | |||||||||||
2024 | 280 | 390 | (92 | ) | (32 | ) | (38 | ) | (18 | ) | 210 | (12 | ) | 198 | - | 198 | 439 | 480 | ||||||||
2025 | 228 | 318 | (96 | ) | (28 | ) | (34 | ) | (1 | ) | 159 | (33 | ) | 126 | - | 126 | 540 | 686 | ||||||||
2026 | 204 | 285 | (95 | ) | (26 | ) | (24 | ) | 0 | 141 | (24 | ) | 116 | - | 116 | 584 | 704 | |||||||||
2027 | 207 | 289 | (99 | ) | (26 | ) | (18 | ) | (1 | ) | 145 | (94 | ) | 52 | - | 52 | 598 | 1,049 | ||||||||
2028 | 189 | 263 | (100 | ) | (24 | ) | 0 | (0 | ) | 140 | (188 | ) | (48 | ) | - | (48 | ) | 649 | 1,642 | |||||||
2029 | 171 | 265 | (131 | ) | (22 | ) | (12 | ) | (5 | ) | 95 | (14 | ) | 81 | - | 81 | 735 | 816 | ||||||||
2030 | 165 | 262 | (141 | ) | (21 | ) | (10 | ) | (2 | ) | 88 | (11 | ) | 77 | - | 77 | 785 | 849 | ||||||||
2031 | 160 | 249 | (148 | ) | (21 | ) | (4 | ) | (2 | ) | 74 | (26 | ) | 48 | - | 48 | 893 | 1,058 | ||||||||
2032 | 213 | 325 | (150 | ) | (27 | ) | (25 | ) | (0 | ) | 123 | (82 | ) | 41 | - | 41 | 692 | 1,076 | ||||||||
2033 | 203 | 315 | (152 | ) | (26 | ) | (28 | ) | (0 | ) | 109 | (84 | ) | 25 | - | 25 | 714 | 1,126 | ||||||||
2034 | 198 | 309 | (192 | ) | (25 | ) | (12 | ) | (8 | ) | 72 | (53 | ) | 19 | - | 19 | 923 | 1,190 | ||||||||
2035 | 225 | 337 | (210 | ) | (26 | ) | (11 | ) | (4 | ) | 86 | (71 | ) | 15 | - | 15 | 940 | 1,254 | ||||||||
2036 | 290 | 441 | (210 | ) | (33 | ) | (40 | ) | 0 | 158 | (34 | ) | 124 | - | 124 | 709 | 827 | |||||||||
2037 | 248 | 367 | (213 | ) | (29 | ) | (23 | ) | (1 | ) | 102 | (7 | ) | 95 | - | 95 | 885 | 913 | ||||||||
2038 | 245 | 355 | (209 | ) | (28 | ) | (24 | ) | 1 | 93 | (15 | ) | 78 | - | 78 | 911 | 973 | |||||||||
2039 | 214 | 319 | (206 | ) | (25 | ) | (17 | ) | 1 | 72 | (30 | ) | 43 | - | 43 | 978 | 1,115 | |||||||||
2040 | 232 | 345 | (209 | ) | (27 | ) | (25 | ) | (0 | ) | 84 | (44 | ) | 40 | - | 40 | 919 | 1,107 | ||||||||
2041 | 340 | 491 | (204 | ) | (39 | ) | (68 | ) | 1 | 181 | (5 | ) | 176 | - | 176 | 659 | 673 | |||||||||
2042 | 352 | 513 | (204 | ) | (40 | ) | (71 | ) | 0 | 198 | (67 | ) | 131 | - | 131 | 625 | 817 | |||||||||
2043 | 275 | 407 | (200 | ) | (32 | ) | (44 | ) | 1 | 133 | (6 | ) | 127 | - | 127 | 750 | 772 | |||||||||
2044 | 300 | 442 | (201 | ) | (34 | ) | (54 | ) | (0 | ) | 152 | (14 | ) | 138 | - | 138 | 704 | 751 | ||||||||
2045 | 203 | 312 | (178 | ) | (23 | ) | (27 | ) | 5 | 88 | (7 | ) | 81 | - | 81 | 846 | 882 | |||||||||
2046 | 173 | 254 | (128 | ) | (20 | ) | (26 | ) | 10 | 90 | (2 | ) | 88 | - | 88 | 773 | 783 | |||||||||
2047 | 92 | 133 | (73 | ) | (11 | ) | (12 | ) | 11 | 48 | (22 | ) | 26 | - | 26 | 849 | 1,092 | |||||||||
2048 | - | - | - | 0 | 0 | 14 | 14 | - | 14 | - | 14 | - | - | |||||||||||||
Total | 5,407 | 7,988 | (3,843 | ) | (641 | ) | (650 | ) | - | 2,855 | (944 | ) | 1,911 | (217 | ) | 1,694 | 742 | 916 | ||||||||
(1) | All figures are rounded to reflect the relative accuracy of the estimate. Totals may not sum due to rounding. |
(2) | Commencing November 2021. |
(3) | Revenue is based on long-term gold and silver prices of US$1,500 and US$20.22 per ounce, respectively, and US$3.13 per lb for copper. Revenues reflect the terms of the PMPA with WPMI. Under the terms of the PMPA, WPMI will purchase 10% of the gold and 50% of the silver production in exchange for up-front cash deposits totaling $153.5 million, of which US$15.5 million has already been received and the remaining US$138.0 million will be received during construction of the Project. In addition, WPMI will make ongoing payments to the Company once Toroparu is in operation at the lesser of the market price and US$400 per payable ounce of gold delivered over the life of the Project (subject to a 1% annual increase starting after the third year of production) and at the lesser of the market price and US$3.90 per payable ounce of silver delivered over the life of the Project (subject to a 1% annual increase starting after the fourth year of production). |
(4) | Initial capex represents the upfront capital costs for the development and construction of the Project totaling US$352.8 million, net of US$138.0 million of up-front cash deposits to be received from WPMI under the PMPA. |
(5) | Cash cost per ounce is a non-IFRS measure and is calculated on a by-product credit basis by deducting revenues from silver and copper production from the sum of opex, royalties and freight insurance and dividing the sum by the number of gold ounces produced. Opex includes mining, processing, site administration costs, freight, treatment and refining charges. |
(6) | AISC per ounce is a non-IFRS measure which adds sustaining capital per ounce produced to cash cost per ounce. |
A conventional truck-shovel method was considered for the open pit portion of the Toroparu Deposit. The open pit analysis results in several distinct open pits coalescing into the NW and Main Toroparu Pits over time. The Sona Hill and Southeast Zone (SE) will be developed in a similar fashion beginning in year 3 and 6 respectively. The final dimensions of the NW Pit are approximately 990 m long x 690 m wide x 360 m deep. The dimensions of the Main Pit are approximately 1,300 m long x 750 m wide x 470 m deep. The open pit LoM plan proposes to mine approximately 93 Mt at a cut-off grade of 0.5 g/t Au and 558 Mt of waste rock material. The average stripping ratio for the open pit operations is 6:1 over the LoM. Each pit is currently planned to be developed with 29 phases each. Compacted saprolitic waste material will be used to construct haul roads, facility pads and flood control berms, levies and other structures.
Figures 1 & 2 accompanying this announcement are available at https://www.globenewswire.com/NewsRoom/AttachmentNg/d7b3f570-60c4-4636-9b7d-e3fbb1b9b299
Underground development will commence at the beginning of the ninth year of open pit operation and targets 3,500 tpd, ramping up to full production over an approximately two-year period. The ramp-up allows for the main ramp system development at the 250 m elevation down from the surface portal in the NW Pit and to connect to both fresh air and return air raises, providing ventilation and secondary egress for the mine. Underground production is scheduled based on approximately 3,500 tpd mill feed and 750 tpd average waste, excavated using a fleet of 15 and 10 tonne load-haul-dump loaders, hauled with 45 tonne trucks using the ramps to portals entrances and rehandled using the surface fleet. Production is expected to commence in the central area between the Main and NW Pits from 360 Level (approximately 360 m elevation below surface) and continues for the first 2 years in a bottom-up sequence. It is anticipated that mining next transitions to production from lower mining areas below and around Main and NW Pits for approximately the final 10 years of the LoM.
Figure 3 accompanying this announcement is available at https://www.globenewswire.com/NewsRoom/AttachmentNg/64873fb2-268a-4c3c-b5e7-99e91393a8ff
Next Steps Toward the Development of the Toroparu Project
The results of the PEA for Toroparu affirm the Project’s technical and financial merits using base case and sensitivity metal price assumptions and the inputs in some areas from advanced historical studies completed by Gold X Mining that were at Pre-Feasibility Study (“PFS”) or Feasibility Study (“FS”) levels. The Company plans to execute the mine plan outlined in the PEA in phases, commencing initially with construction of the Phase I surface mine and the 7,000 tpd gold leach process mill. A PFS focused on the initial 10 years of surface mining is anticipated to be completed in the first quarter of 2022.
The Government had previously accepted the previous PEA prepared by Gold X Mining in July 2019 as satisfying the requirement in the Company’s Mineral Agreement for delivery of a technical study demonstrating the feasibility of the Project. Since this new PEA reflects a major, and much improved, change in the operating plan for the Project, it is expected that the Government will review this PEA prior to issuing the Mining License in 2022.
The Company has hired Haukes Construction (Guyana) Ltd., a division of Haukes NV of Suriname, for construction of the preliminary earthworks at Toroparu, with development of the permanent man-camp, airstrip and rock quarries currently underway. Rehabilitation of the historical access road constructed in 2004 that links Toroparu to tidewater at Itaballi Station, at the confluence of the Mazaruni, Cuyuni and Essequibo Rivers, is expected to commence in the first quarter of 2022.
Technical Report and Qualified Persons
A Technical Report prepared in accordance with NI 43-101 for the Toroparu Gold Project PEA will be filed on SEDAR (www.sedar.com) on or before January 14, 2022. Readers are encouraged to read the Technical Report in its entirety, including all qualifications, assumptions and exclusions that relate to the Mineral Resource. The Technical Report is intended to be read as a whole, and sections should not be read or relied upon out of context.
Disclosure of a scientific or technical nature in this news release has been approved by Glen Kuntz, P. Geo. (Ontario) of Nordmin Engineering Ltd., a "Qualified Person". Mr. Kuntz has verified the data disclosed in this news release, including sampling, analytical and test data underlying the information it contains.
The Qualified Person responsible for the preparation of the Toroparu Gold Project Updated Mineral Resource Estimate is Glen Kuntz, P. Geo. (Ontario) of Nordmin Engineering Ltd. The Qualified Person responsible for the preparation of the Open Pit Mine Design and Costing, Combined Underground and Open Pit Production schedule, and Economic analysis is Fernando Rodrigues, P. Eng. of SRK Consulting (USA) Ltd. The Qualified Person responsible for the preparation of the Underground Mine Design Costing, and Sequencing is Brian Wissent, P. Eng. (Ontario) of Nordmin Engineering Ltd. The Qualified Persons responsible for the preparation of the Pit Slope and Underground Geotechnical Designs and specifications are Daniel Yang, P. Eng. and Ben Peacock, P. Eng. of Knight Piesold. Kurt Boyko, P.Eng., of Nordmin Engineering Ltd. is the Qualified Person responsible for processing, metallurgy, and Surface Infrastructure. Gonzalo Nureno, P. Eng. of Klohn Crippen Berger is the Qualified Person responsible for design of the TSF, its water management infrastructure, site water balance and surface water management, and Closure. Each of Messrs. Kuntz, Rodrigues, Wissent, Yang, Peacock, Boyko, and Nureno are considered to be an “Independent Qualified Person” under NI 43-101.
About GCM Mining Corp.
GCM Mining Corp. is a mid-tier gold producer with a proven track record of mine building and operating in Latin America. In Colombia, the Company is currently the largest underground gold and silver producer with several mines in operation at its high-grade Segovia Operations. In Guyana, the Company is advancing the Toroparu Project, one of the largest undeveloped gold/copper projects in the Americas. The Company also owns an approximately 44% equity interest in Aris Gold Corporation (TSX: ARIS) (Colombia – Marmato), an approximately 27% equity interest in Denarius Silver Corp. (TSX-V: DSLV) (Spain – Lomero-Poyatos; Colombia – Guia Antigua and Zancudo) and an approximately 26% equity interest in Western Atlas Resources Inc. (TSX-V: WA) (Nunavut – Meadowbank).
Additional information on GCM Mining can be found on its website at www.gcm-mining.com and by reviewing its profile on SEDAR at www.sedar.com.
Cautionary Statement on Forward-Looking Information:
This news release contains "forward-looking information", which may include, but is not limited to, statements with respect to Mineral Resource estimates, future production, the development and construction of mining and processing operations, capital expenditures and projected financial results, and the timing of any of the foregoing, in addition to its anticipated business plans or strategies. Often, but not always, forward-looking statements can be identified by the use of words such as "plans", "expects", "is expected", "budget", "scheduled", "estimates", "forecasts", "intends", "anticipates", or "believes" or variations (including negative variations) of such words and phrases, or state that certain actions, events or results "may", "could", "would", "might" or "will" be taken, occur or be achieved. Forward-looking statements involve known and unknown risks, uncertainties and other factors which may cause the actual results, performance or achievements of the Company to be materially different from any future results, performance or achievements expressed or implied by the forward-looking statements. Factors that could cause actual results to differ materially from those anticipated in these forward-looking statements include but are not limited to development or mining results not being consistent with the Company’s expectations, risks associated with the estimation of Mineral Resources and the geology, grade and continuity of mineral deposits including but not limited to models relating thereto; actual ore mined or metal recoveries varying from Mineral Resource estimates, mine plans and LoM estimates, including all of the factors considered in developing the LoM plan and all key operating and financial metrics used in calculating the LoM in the PEA; the anticipated timing at which various phases of mining will commence; the timing of the completion of the PFS focusing on the first ten years of surface mining; the commencement date of the rehabilitation of the Southern Access Road; and those risks described under the caption "Risk Factors" in the Company's Annual Information Form dated as of March 31, 2021 which is available for view on SEDAR at www.sedar.com. Forward-looking statements contained herein are made as of the date of this press release and the Company disclaims, other than as required by law, any obligation to update any forward-looking statements whether as a result of new information, results, future events, circumstances, or if management's estimates or opinions should change, or otherwise. There can be no assurance that forward-looking statements will prove to be accurate, as actual results and future events could differ materially from those anticipated in such statements. Accordingly, the reader is cautioned not to place undue reliance on forward-looking statements.
Reliance on PEA and Mineral Resource Estimates
A PEA is a comprehensive study of a range of options for the technical and economic viability of a mineral project that has advanced to a stage where a preferred mining method, in the case of underground mining, or the pit configuration, in the case of an open pit, is established and an effective method of mineral processing is determined. It includes a financial analysis based on reasonable assumptions on any modifying factors and the evaluation of any other relevant factors which are sufficient for a Qualified Person, acting reasonably, to determine if all or part of the Mineral Resource may be converted to a Mineral Reserve at the time of reporting. A PEA is at a lower confidence level than a PFS or FS.
The Mineral Resources in this press release were estimated using the CIM Standards on Mineral Resources and Reserves, Definitions and Guidelines prepared by the CIM Standing Committee on Reserve Definitions and adopted by the CIM Council and incorporated by reference in National Instrument 43-101 – Standards of Disclosure for Mineral Projects. Mineral Resources that are not Mineral Reserves do not have demonstrated economic viability. The estimate of Mineral Resources may be materially affected by environmental, permitting, legal, title, taxation, socio-political, marketing, or other relevant issues. The Inferred Mineral Resource in this estimate has a lower level of confidence than that applied to an Indicated Mineral Resource and must not be converted to a Mineral Reserve. There is no certainty that Inferred Mineral Resources will be converted to the Measured and Indicated Resource categories through further drilling, or into Mineral Reserves, once economic considerations are applied. Therefore, readers are cautioned not to assume that part or all of an Inferred Mineral Resource exists or is economically or legally mineable.
For Further Information, Contact:
Mike Davies
Chief Financial Officer
(416) 360-4653
investorrelations@grancolombiagold.com
(1)

