
 Yahoo Finance
 Future Data Group Limited (HKG:8229): Can It Deliver A Superior ROE To The Industry?

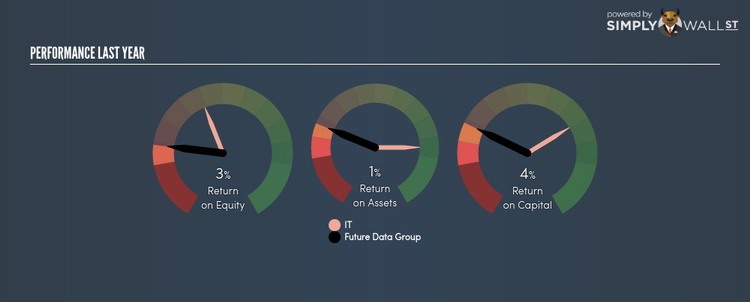
Future Data Group Limited’s (SEHK:8229) most recent return on equity was a substandard 2.71% relative to its industry performance of 12.56% over the past year. Though 8229’s recent performance is underwhelming, it is useful to understand what ROE is made up of and how it should be interpreted. Knowing these components can change your views on 8229’s below-average returns. Metrics such as financial leverage can impact the level of ROE which in turn can affect the sustainability of 8229’s returns. Let me show you what I mean by this. Check out our latest analysis for Future Data Group
Peeling the layers of ROE – trisecting a company’s profitability
Return on Equity (ROE) weighs Future Data Group’s profit against the level of its shareholders’ equity. An ROE of 2.71% implies HK$0.03 returned on every HK$1 invested. While a higher ROE is preferred in most cases, there are several other factors we should consider before drawing any conclusions.
Return on Equity = Net Profit ÷ Shareholders Equity
ROE is measured against cost of equity in order to determine the efficiency of Future Data Group’s equity capital deployed. Its cost of equity is 5.78%. This means Future Data Group’s returns actually do not cover its own cost of equity, with a discrepancy of -3.07%. This isn’t sustainable as it implies, very simply, that the company pays more for its capital than what it generates in return. ROE can be broken down into three different ratios: net profit margin, asset turnover, and financial leverage. This is called the Dupont Formula:
Dupont Formula
ROE = profit margin × asset turnover × financial leverage
ROE = (annual net profit ÷ sales) × (sales ÷ assets) × (assets ÷ shareholders’ equity)
ROE = annual net profit ÷ shareholders’ equity
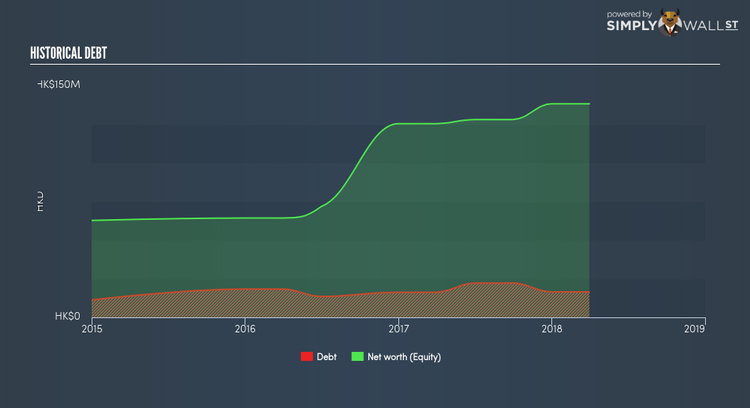
The first component is profit margin, which measures how much of sales is retained after the company pays for all its expenses. Asset turnover shows how much revenue Future Data Group can generate with its current asset base. Finally, financial leverage will be our main focus today. It shows how much of assets are funded by equity and can show how sustainable the company’s capital structure is. Since financial leverage can artificially inflate ROE, we need to look at how much debt Future Data Group currently has. At 11.95%, Future Data Group’s debt-to-equity ratio appears low and indicates that Future Data Group still has room to increase leverage and grow its profits.
Next Steps:
ROE is one of many ratios which meaningfully dissects financial statements, which illustrates the quality of a company. Future Data Group’s ROE is underwhelming relative to the industry average, and its returns were also not strong enough to cover its own cost of equity. However, ROE is not likely to be inflated by excessive debt funding, giving shareholders more conviction in the sustainability of returns, which has headroom to increase further. Although ROE can be a useful metric, it is only a small part of diligent research.
For Future Data Group, I’ve put together three fundamental aspects you should further examine:
Financial Health: Does it have a healthy balance sheet? Take a look at our free balance sheet analysis with six simple checks on key factors like leverage and risk.
Valuation: What is Future Data Group worth today? Is the stock undervalued, even when its growth outlook is factored into its intrinsic value? The intrinsic value infographic in our free research report helps visualize whether Future Data Group is currently mispriced by the market.
Other High-Growth Alternatives : Are there other high-growth stocks you could be holding instead of Future Data Group? Explore our interactive list of stocks with large growth potential to get an idea of what else is out there you may be missing!
To help readers see pass the short term volatility of the financial market, we aim to bring you a long-term focused research analysis purely driven by fundamental data. Note that our analysis does not factor in the latest price sensitive company announcements.
The author is an independent contributor and at the time of publication had no position in the stocks mentioned.
