
 Yahoo Finance
 FS KKR Capital's (FSK) Q3 Earnings Beat on Higher Revenues
FS KKR Capital Corp.’s FSK third-quarter 2019 adjusted net investment income (NII) of 22 cents per share surpassed the Zacks Consensus Estimate of 19 cents. However, the bottom line was 8.3% below the year-ago quarter figure.
Results reflect substantial increase in revenues and a strong balance sheet position. However, increase in expenses was an undermining factor.
NII (GAAP Basis) came in at $115 million, up from $56 million in the prior-year quarter.
Total Investment Income & Expenses Surge
Total investment income was $199 million, up significantly from $95 million in the year-ago quarter. The rise was mainly driven by higher interest income. Also, the figure beat the Zacks Consensus Estimate of $193.4 million.
Total operating expenses jumped substantially year over year to $84 million. Drastic surge in interest expense and management fees was the primary reason for the increase.
The fair value of FS KKR Capital’s total investment portfolio was $7.2 billion as of Sep 30, 2019.
As of Sep 30, 2019, FS KKR Capital’s net asset value was $7.86 per share compared with $8.64 as of Sep 30, 2018.
Strong Balance Sheet Position
The company had $7.8 billion in total assets and $4 billion in total stockholders’ equity as of Sep 30, 2019.
At the end of the third quarter, the debt/equity ratio was 0.78. Cash and foreign currency totaled $126 million as of Sep 30, 2019.
Share Repurchase Update
FSK KKR Capital has repurchased $136 million worth of shares through Nov 6, 2019 under the previously announced $200 million share buyback plan.
Our Take
Steady improvement in total investment income and strong origination volume are expected to support FS KKR Capital’s profitability. However, considerable increase in operating expenses is a major concern.
FS Investment Corporation Price, Consensus and EPS Surprise
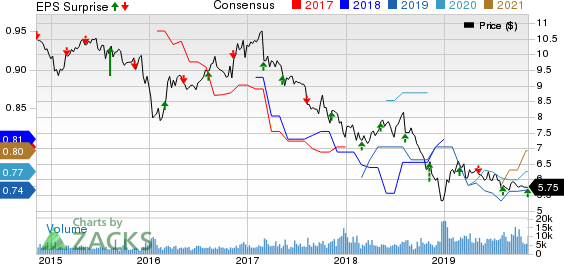
FS Investment Corporation price-consensus-eps-surprise-chart | FS Investment Corporation Quote
Currently, FS KKR Capital carries a Zacks Rank #2 (Buy). You can see the complete list of today’s Zacks #1 Rank (Strong Buy) stocks here.
Performance of Other Finance Stocks
Prospect Capital Corporation’s PSEC first-quarter fiscal 2020 (ended Sep 30) net investment income of 19 cents per share came in line with the Zacks Consensus Estimate. The bottom-line figure decreased 17.4%, year over year.
Hercules Capital Inc.’s HTGC third-quarter 2019 net investment income of 37 cents per share outpaced the Zacks Consensus Estimate of 34 cents. The bottom line grew 19.4% from the year-ago figure.
Newtek Business Services Corp.’s NEWT third-quarter 2019 adjusted net investment income of 63 cents per share outpaced the Zacks Consensus Estimate of 57 cents. The bottom-line figure also jumped 26% year on year.
Today's Best Stocks from Zacks
Would you like to see the updated picks from our best market-beating strategies? From 2017 through 2018, while the S&P 500 gained +15.8%, five of our screens returned +38.0%, +61.3%, +61.6%, +68.1%, and +98.3%.
This outperformance has not just been a recent phenomenon. From 2000 – 2018, while the S&P averaged +4.8% per year, our top strategies averaged up to +56.2% per year.
See their latest picks free >>
Want the latest recommendations from Zacks Investment Research? Today, you can download 7 Best Stocks for the Next 30 Days. Click to get this free report
Prospect Capital Corporation (PSEC) : Free Stock Analysis Report
Hercules Capital, Inc. (HTGC) : Free Stock Analysis Report
Newtek Business Services Corp. (NEWT) : Free Stock Analysis Report
FS Investment Corporation (FSK) : Free Stock Analysis Report
To read this article on Zacks.com click here.
Zacks Investment Research
