
 Yahoo Finance
 Forex Volatility Surges. Why? And What Might we do Next?
DailyFX.com -
- Forex volatility risks surge on sudden market panic
- Our focus shifts towards our volatility-friendly strategies
- Keep an eye on stocks and 'risk' for next clues on price action
The US Dollar tumbled and the Japanese Yen surged as global stock markets sold off sharply. What happened? And more importantly, what might we expect next?
Markets entered a veritable panic as we saw the Shanghai Composite post a remarkable 8.5 percent at the Sunday open, and contagion gripped broader markets as the US Dow Jones Industrial Average lost over 6 percent to start Monday trading. The effects in global currencies was similarly swift: the US Dollar entered a veritable free-fall versus the Japanese Yen as the USD/JPY shed a remarkable 300+ pips in under 15 minutes.
Why?
Markets ostensibly fell because of the initial panic in Chinese markets, but a simpler explanation is to claim that fear gripped a broad swath of traders in what is typically supposed to be a quiet period for financial markets. To that end we attempt to measure the likelihood that such fear-driven moves will continue.
FX derivatives markets predict that the coming week will see the largest currency moves since early June—hardly a major warning of turmoil ahead. It is perhaps a reminder that a three-day stretch market panic won’t necessarily translate into an extended sell-off. Yet it will be important to trade defensively until we see meaningful signs of normal market conditions.
Forex Volatility Prices Surge on Sudden Market Panic, Point to Bigger Moves Ahead
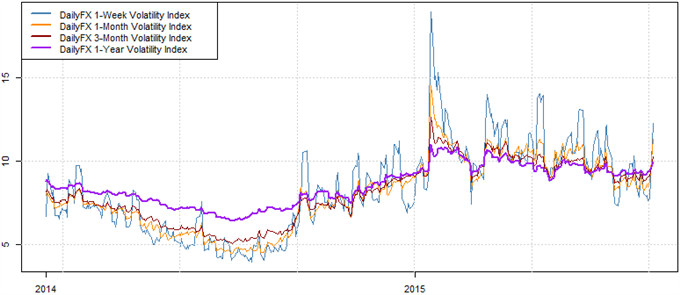
Data source: Bloomberg, DailyFX Calculations
A study of retail trader performance shows that most tend to do poorly during times of high volatility. Why exactly? Put simply, most retail traders tend to range trade—buy when prices are low and sell when prices are high. And indeed we might expect such a strategy will underperform if markets are seeing major price extension in one direction.
Traders should likely avoid range trading until we see some semblance of ‘normalcy’ in currency trading markets. In the meantime we’ll look to our volatility-friendly Breakout2 to outperform across key US Dollar and Japanese Yen pairs.
Options-based volatility prices are historically the best predictors of actual market moves. Obviously no indicator is perfect, but given elevated levels we would expect the recent episode of market swings to continue.
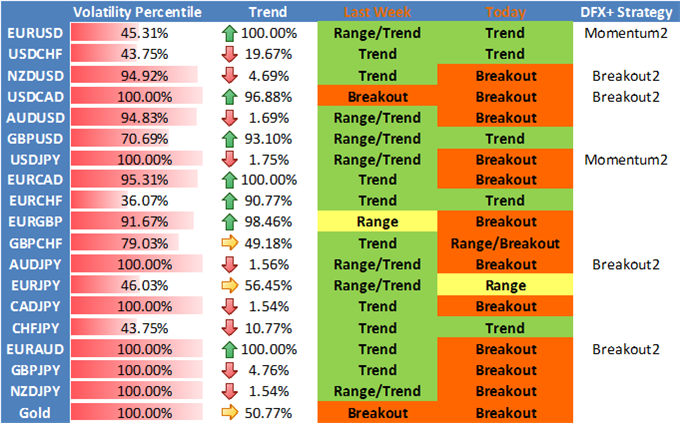
See the table below for full detail on market conditions and preferred trading strategies.
DailyFX Individual Currency Pair Conditions and Trading Strategy Bias
Understand the Breakout2 Trading System via our previous article
Auto trade the trend reversal-trading Momentum2system via our previous article.
Trade with strong trends via our Momentum1 Trading System
Use our counter-trend Range2 Trading system
--- Written by David Rodriguez, Quantitative Strategist for DailyFX.com
To receive the Speculative Sentiment Index and other reports from this author via e-mail, sign up to David’s e-mail distribution list via this link.
Contact David via Twitter at http://www.twitter.com/DRodriguezFX
Definitions
Volatility Percentile – The higher the number, the more likely we are to see strong movements in price. This number tells us where current implied volatility levels stand in relation to the past 90 days of trading. We have found that implied volatilities tend to remain very high or very low for extended periods of time. As such, it is helpful to know where the current implied volatility level stands in relation to its medium-term range.
Trend – This indicator measures trend intensity by telling us where price stands in relation to its 90 trading-day range. A very low number tells us that price is currently at or near 90-day lows, while a higher number tells us that we are near the highs. A value at or near 50 percent tells us that we are at the middle of the currency pair’s 90-day range.
Range High – 90-day closing high.
Range Low – 90-day closing low.
Last – Current market price.
Bias – Based on the above criteria, we assign the more likely profitable strategy for any given currency pair. A highly volatile currency pair (Volatility Percentile very high) suggests that we should look to use Breakout strategies. More moderate volatility levels and strong Trend values make Momentum trades more attractive, while the lowest Vol Percentile and Trend indicator figures make Range Trading the more attractive strategy.
HYPOTHETICAL PERFORMANCE RESULTS HAVE MANY INHERENT LIMITATIONS, SOME OF WHICH ARE DESCRIBED BELOW. NO REPRESENTATION IS BEING MADE THAT ANY ACCOUNT WILL OR IS LIKELY TO ACHIEVE PROFITS OR LOSSES SIMILAR TO THOSE SHOWN. IN FACT, THERE ARE FREQUENTLY SHARP DIFFERENCES BETWEEN HYPOTHETICAL PERFORMANCE RESULTS AND THE ACTUAL RESULTS SUBSEQUENTLY ACHIEVED BY ANY PARTICULAR TRADING PROGRAM.
ONE OF THE LIMITATIONS OF HYPOTHETICAL PERFORMANCE RESULTS IS THAT THEY ARE GENERALLY PREPARED WITH THE BENEFIT OF HINDSIGHT. IN ADDITION, HYPOTHETICAL TRADING DOES NOT INVOLVE FINANCIAL RISK, AND NO HYPOTHETICAL TRADING RECORD CAN COMPLETELY ACCOUNT FOR THE IMPACT OF FINANCIAL RISK IN ACTUAL TRADING. FOR EXAMPLE, THE ABILITY TO WITHSTAND LOSSES OR TO ADHERE TO A PARTICULAR TRADING PROGRAM IN SPITE OF TRADING LOSSES IS MATERIAL POINTS WHICH CAN ALSO ADVERSELY AFFECT ACTUAL TRADING RESULTS. THERE ARE NUMEROUS OTHER FACTORS RELATED TO THE MARKETS IN GENERAL OR TO THE IMPLEMENTATION.
OF ANY SPECIFIC TRADING PROGRAM WHICH CANNOT BE FULLY ACCOUNTED FOR IN THE PREPARATION OF HYPOTHETICAL PERFORMANCE RESULTS AND ALL OF WHICH CAN ADVERSELY AFFECT ACTUAL TRADING RESULTS.
Any opinions, news, research, analyses, prices, or other information contained on this website is provided as general market commentary, and does not constitute investment advice. The FXCM group will not accept liability for any loss or damage, including without limitation to, any loss of profit, which may arise directly or indirectly from use of or reliance contained in the trading signals, or in any accompanying chart analyses.
DailyFX provides forex news and technical analysis on the trends that influence the global currency markets.
Learn forex trading with a free practice account and trading charts from FXCM.
