
 Yahoo Finance
 Forex: US Dollar Chart Setup Shows Reversal Warning Signs
THE TAKEAWAY: US Dollar technical positioning is now showing signs of a possible reversal lower as prices test resistance marked by the 2012 yearly high.
US DOLLAR TECHNICAL ANALYSIS– Prices put in a bearish Dark Cloud Cover candlestick pattern below resistance in the 10323-26 area, marked by the 123.6% Fibonacci expansion and the 2012 yearly high. The setup hints a move lower is ahead, with negative RSI divergence reinforcing the case for a downside scenario. Near-term support is at 10248, the 100% Fib, with a break below that exposing rising channel resistance-turned-support at 10221.

Daily Chart - Created Using FXCM Marketscope 2.0
S&P 500 TECHNICAL ANALYSIS – Prices broke above resistance at 1513.20, the 114.6% Fibonacci expansion. Buyers now aim to challenge the 123.6% level at 1523.00, with a break above that targeting the 138.2% mark at 1538.70 (now shown). The 1513.20 level has been recast as near-term support. A reversal back below that initially exposes the 100% Fib at 1497.50.
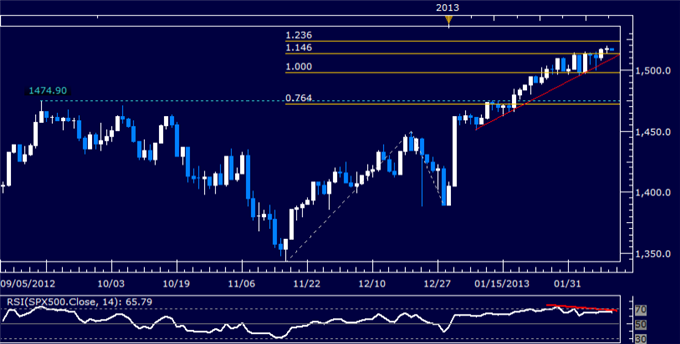
Daily Chart - Created Using FXCM Marketscope 2.0
GOLD TECHNICAL ANALYSIS – Prices broke critical rising trend line support set from mid-May 2012. Sellers are now testing the 38.2% Fibonacci expansion (1648.20), with a confirmed break exposing the 50% mark at 1633.06. The trend line – now at 1660.27 – has been recast as near-term resistance.
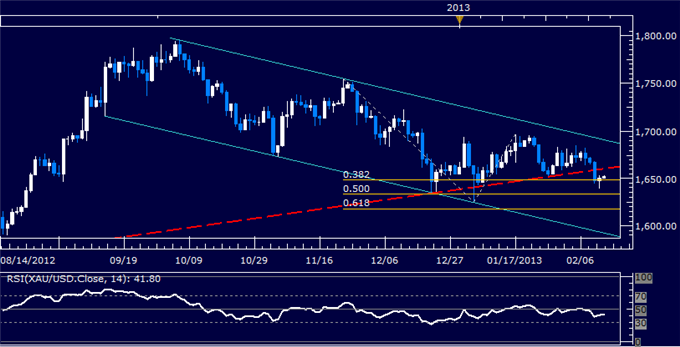
Daily Chart - Created Using FXCM Marketscope 2.0
CRUDE OIL TECHNICAL ANALYSIS– Prices are rebounding from support at 95.14, the 23.6% Fibonacci retracement. Near-term resistance is in the 98.02-21 area, marked by the 23.6% Fib expansion and the January 30 swing high. A break above that targets the 38.2% expansion at 99.91. Alternatively, a reversal below 95.14 initially eyes 93.24.
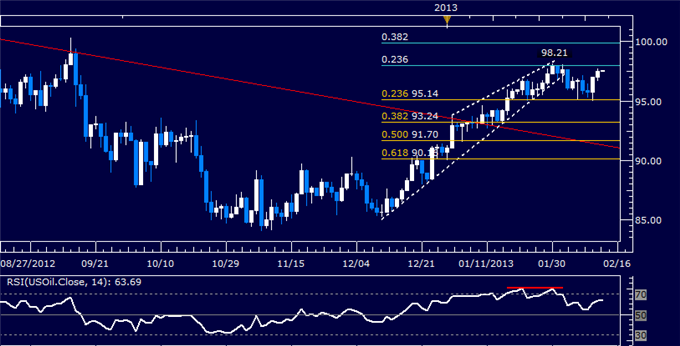
Daily Chart - Created Using FXCM Marketscope 2.0
--- Written by Ilya Spivak, Currency Strategist for Dailyfx.com
To contact Ilya, e-mail ispivak@dailyfx.com. Follow Ilya on Twitter at @IlyaSpivak
To be added to Ilya's e-mail distribution list, please CLICK HERE
DailyFX provides forex news and technical analysis on the trends that influence the global currency markets.
Learn forex trading with a free practice account and trading charts from FXCM.
