
 Yahoo Finance
 FOREX Trading: USD/JPY Testing Late 2008 and Early 2009 Levels
Afternoon Technicals (all charts)
FOREX Trading and Technical Analysis Observations
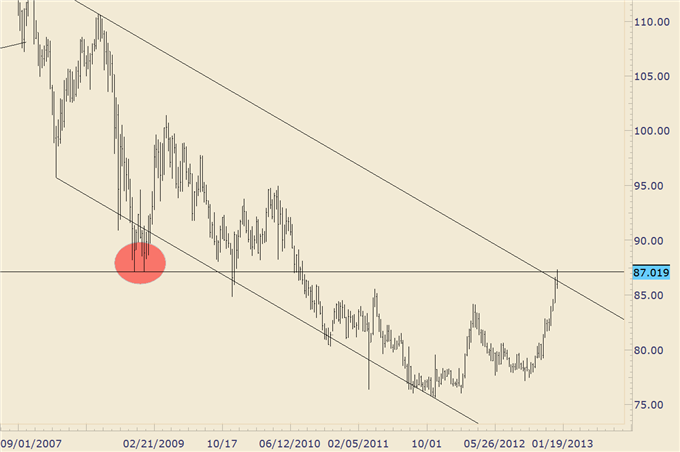
2013 begins with the USDJPY testing resistance from late 2008 / early 2009 lows (weekly chart) and sharp channel resistance (see daily chart). The rally since the beginning of December can be best described as parabolic, especially since 12/26. In Elliott parlance, a parabolic move is usually a 3rd or C wave. If the current rally composes a 3rd wave, then we’ve probably reached or are very close to reaching ‘fever pitch’ and giving way to a corrective decline. Weakness below 8650 would be the trigger for me to begin a short position towards at least 8565.
Other pairs on the watch list include
The EURUSD, which may be tracing out a triangle from the 12/19 high. The implications are for a terminal thrust above 13308 before a return to at least 13160.
The AUDUSD and NZDUSD, which have already retraced more than 61.8% of their December declines. Price is below the highs but Twitter comments would make it seem as though these pairs are at record highs. I’m on the lookout for secondary tops.
The EURAUD and EURNZD dips are approaching moving average (20 day) support at 12540 and 12770. I’m on the lookout for lows and continuation of the larger bull move that began last summer.
USDJPY - Weekly
Prepared by Jamie Saettele, CMT
USDJPY – Daily

Prepared by Jamie Saettele, CMT
--- Written by Jamie Saettele, CMT, Senior Technical Strategist for DailyFX.com
To contact Jamie e-mail jsaettele@dailyfx.com. Follow me on Twitter for real time updates @JamieSaettele
Subscribe to Jamie Saettele's distribution list in order to receive actionable FX trading strategy delivered to your inbox.
Jamie is the author of Sentiment in the Forex Market.
DailyFX provides forex news and technical analysis on the trends that influence the global currency markets.
Learn forex trading with a free practice account and trading charts from FXCM.
