
 Yahoo Finance
 Forex: Commodity Currencies Soft, Yen Reverses on Strong Chinese Data
ASIA/EUROPE FOREX NEWS WRAP
Risk appetite has been put on hold overnight, with the S&P 500 (fair value) trading up towards key resistance at 1492/97, the 161.8% Fibonacci extension off of the November and December lows. There were two major catalysts since US cash equity trading closed on Wednesday: disappointing earnings from Apple; and a stronger than expected Chinese manufacturing reading. While Apple is likely to hurt US equity markets today, the Chinese data has provoked a very interesting response in FX.
Usually when strong Chinese data comes out, there are three reactions: the Australian Dollar rallies; the New Zealand Dollar follows the Aussie, just not as great of a magnitude; and the Japanese Yen weakens. Yet neither the Australian Dollar nor the New Zealand Dollar are top performers today; in fact, they’re among the weakest. Rather, it is likely that the weak 4Q’12 inflation data we’ve seen out of both countries the past week are continuing to guide rate expectations; the strong Chinese HSBC Flash PMI Manufacturing for January did little to offset these concerns.
Despite the tepid reaction in the commodity currencies, the Japanese Yen is very much playing the part of a weak safe haven in light of the strong Chinese data. But Yen weakness was accentuated overnight by further manipulative commentary from Japanese governmental leaders, with Deputy Economic Minister Yasutoshi Nishimura saying that “the current [USDJPY] level around 90 can be said to be a correction of the strong Yen, but it isn’t over.” Mr. Nishimura continued to say that an acceptable level for the USDJPY would be 100.00. My yearend forecast for USDJPY remains105.00 to 110.00.
Taking a look at European credit, peripheral yields are mostly lower, providing light support for the Euro again. The Italian 2-year note yield has decreased to 1.438% (-0.7-bps) while the Spanish 2-year note yield has decreased to 2.433% (-4.3-bps). Similarly, the Italian 10-year note yield has decreased to 4.165% (-1.8-bps) while the Spanish 10-year note yield has decreased to 4.998% (-4.1-bps); lower yields imply higher prices.
RELATIVE PERFORMANCE (versus USD): 11:35 GMT
EUR: +0.09%
CHF: -0.06%
GBP: -0.11%
CAD:-0.16%
NZD:-0.18%
AUD:-0.55%
JPY:-1.07%
Dow Jones FXCM Dollar Index (Ticker: USDOLLAR): +0.32% (+0.41% past 5-days)
ECONOMIC CALENDAR
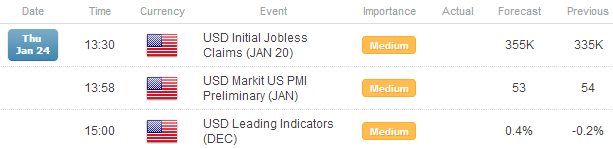
See the DailyFX Economic Calendar for a full list, timetable, and consensus forecasts for upcoming economic indicators.
TECHNICAL ANALYSIS OUTLOOK

EURUSD: No change: “the RSI downtrend that was broken last week was the clue for further strength. Accordingly, I maintain that “focus is on buying dips.” It now appears that a Bull Flag has formed on the daily chart, with a break above 1.3400/10 signaling a move towards 1.3485. Support comes in 1.3280/3310, 1.3120/45, 1.3090/95 (50-EMA), and 1.3000 (January low). Resistance is 1.3380/85 (mid-March swing high), 1.3400/10 and 1.3485 (late-February swing high).

USDJPY: The past few weeks I’ve maintained: “the market remains very net-short the JPY, so a near-term top marked by an event seems possible (think the US Dollar bottoming the day after QE3 was announced)).” The retrace appears to have ended overnight, with the USDJPY rallying nearly 150-pips. Resistance comes at 89.60/70 and 90.10/30 (monthly R2). Support comes in at 89.10/35, 88.40 (monthly R1) and 87.00/40 (weekly pivot).

GBPUSD: No change as the pair steadies below its 200-DMA: “The pair has broken below ascending TL support off of the July and November lows at 1.6000. A weekly close below this level could accelerate losses through 1.5900/05 (200-DMA) towards the most recent swing low, at 1.5820/25 set in mid-November. Support is 1.5750 and 1.5825. Resistance comes in at 1.5900/10, 1.6000/10, 1.6070/75 (50-EMA), 1.6180, and 1.6300/10 (post-QE3 announcement high in mid-September).”

AUDUSD:No change: “The pair has broken the December highs and a break signals a push towards 1.0605/25. However, it’s worth noting that the daily RSI hasn’t pushed into overbought territory on any rally since February 2012. Accordingly, we’ll either see a move to new highs and with RSI confirming the breakout; or further consolidation/pullback is in order before the next leg higher. Support is at 1.0530/50 (weekly pivot, monthly R1), 1.0465/70 (weekly S1), and 1.0400/05 (weekly S2). Resistance is 1.0530/85 and 1.0605/25 (August and September highs).” It should be added that a weekly close below 1.0530 could signal a deeper retracement towards 1.0350/400.

S&P 500: Earlier last week I said: “The S&P 500is back above a very significant zone of 1445/50 (descending trendline off of September and October highs, 100% Fibonacci extension off of the November 16 low, the November 23 high, and the November 28 low extension), and a move higher necessarily points to 1470/75…Bull Flag is potentially forming on lower timeframes (1H, 4H).” With these levels to the upside breaking, a move above the September highs points to resistance at the 161.8% Fibonacci extension at 1492, 1500 and 1520/25 (December 2007 high). Support comes in at 1470/75, 1450/55, 1425, and 1400.

GOLD: The past few weeks I’ve maintained: "When considering the move off of the September highs, a measured A-B=C-D (as expressed on the Daily) suggests that a bottom could be in place at [1630/40].” The rebound has ensued, with the alternative safe haven rallying up to 1690 today. A daily close above 1700 points towards 1722/25 and 1755. Support is 1675 (20-EMA) and 1640/45.
--- Written by Christopher Vecchio, Currency Analyst
To contact Christopher Vecchio, e-mail cvecchio@dailyfx.com
Follow him on Twitter at @CVecchioFX
To be added to Christopher’s e-mail distribution list, please fill out this form
DailyFX provides forex news and technical analysis on the trends that influence the global currency markets.
Learn forex trading with a free practice account and trading charts from FXCM.
