
 Yahoo Finance
 Forex Analysis: US Dollar Turns Lower as S&P 500 Soars
THE TAKEAWAY: The US Dollar pulled back as expected while the S&P 500 shot aggressively higher in the wake of a deal to avert the fiscal cliff.
US DOLLAR TECHNICAL ANALYSIS– Prices turned downward as expected after putting in a Shooting Star candlestick below resistance at 10044, the 32.8%Fibonacci expansion. Initial support lines up at 9995, the 23.6% expansion, with a break below that aiming for a rising trend line at 9932. Alternatively, a reversal above resistance targets the underside of a formerly supporting trend line at 10059 and the 50% level at 10082.
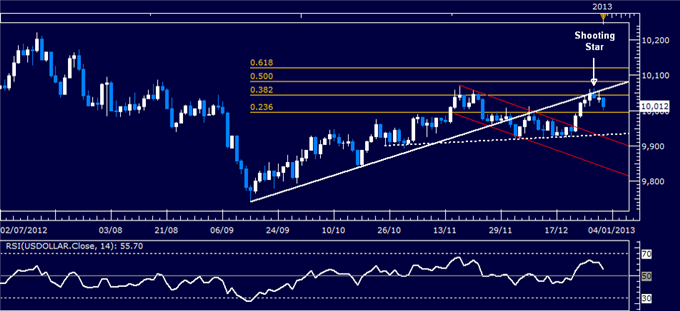
Daily Chart - Created Using FXCM Marketscope 2.0
S&P 500 TECHNICAL ANALYSIS – Prices launched sharply higher in the aftermath of a deal to avert the fiscal cliff to test above resistance at a falling trend line set from mid-September. Initial resistance is at 1450.10, the December 19 high. A break above that targets the October 18 high at 1464.40. Initial support is at 1432.90.

Daily Chart - Created Using FXCM Marketscope 2.0
GOLD TECHNICAL ANALYSIS – Prices are testing through resistance at 1680.80, the 38.2% Fibonacci retracement, with a break above that exposing the 50% level at 1694.82. Near-term support is at 1663.46, the 23.6% retracement.
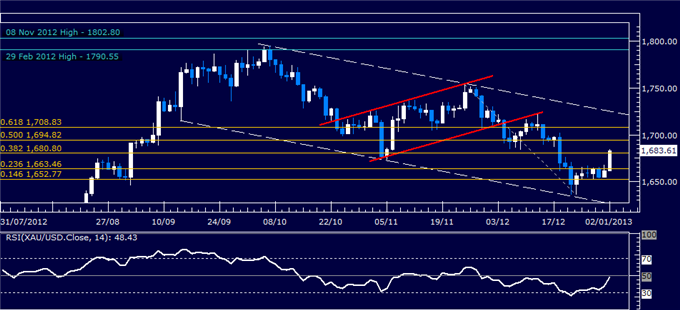
Daily Chart - Created Using FXCM Marketscope 2.0
Want to learn more about RSI? Watch this Video.
CRUDE OIL TECHNICAL ANALYSIS– Prices are pushing aggressively higher, testing through rising channel top resistance to target the 100% Fibonacci expansion at 93.25. A break above that aims for the 123.6% level at 94.51. Near-term support is in the 91.54-92.01 area, marked by the 76.4% Fib and the channel top.

Daily Chart - Created Using FXCM Marketscope 2.0
--- Written by Ilya Spivak, Currency Strategist for Dailyfx.com
To contact Ilya, e-mail ispivak@dailyfx.com. Follow Ilya on Twitter at @IlyaSpivak
To be added to Ilya's e-mail distribution list, please CLICK HERE
DailyFX provides forex news and technical analysis on the trends that influence the global currency markets.
Learn forex trading with a free practice account and trading charts from FXCM.
