
 Yahoo Finance
 Forex Analysis: US Dollar, S&P 500 Charts Warn of Risk Aversion Ahead
THE TAKEAWAY: US Dollar and S&P 500 technical positioning hints the greenback is aiming to reverse higher on the back of haven demand as the equity benchmark turns downward.
US DOLLAR TECHNICAL ANALYSIS– Prices are resting at rising trend line support set from the mid-September bottom, with the outlines of a Flag chart formation hinting at bullish continuation. A Piercing Line candlestick pattern reinforces the case for an upside scenario. A break above Flag resistance at 9976 initially exposes the 23.6% Fibonacci expansion at 9995. Alternatively, a drop below the trend line (now at 9942) targets the Flag bottom at 9895.
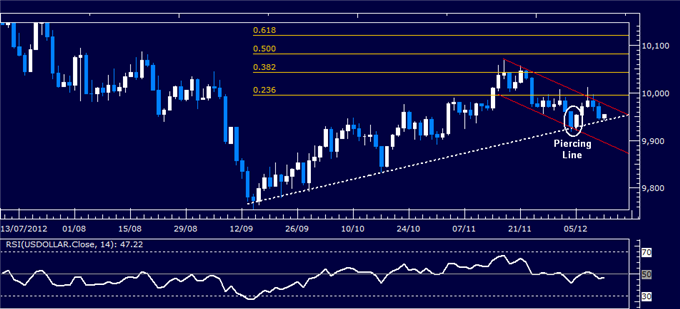
Daily Chart - Created Using FXCM Marketscope 2.0
S&P 500 TECHNICAL ANALYSIS – Prices are testing resistance in the 1425.40-38.90 area, a barrier reinforced by a falling trend line set from the mid-September swing high (now at 1441.20). A break above that aims to challenge the next upside hurdle at 1466.10. The appearance of a bearish continuation Flag chart formation warns of a forthcoming turn lower however. A break below the Flag bottom at 1409.40 confirms the setup, exposing a measured downside target at 1376.70.
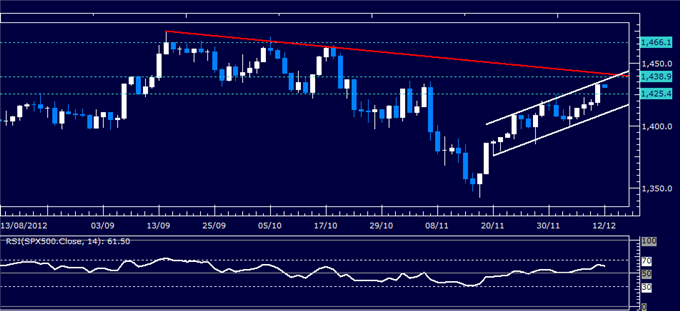
Daily Chart - Created Using FXCM Marketscope 2.0
GOLD TECHNICAL ANALYSIS – Prices broke lower after putting in a Bearish Engulfing candlestick pattern, taking out support at a rising trend line set from late June. Sellers are retesting this barrier as resistance (now at 1715.26), with a Hanging Man candle warning that selling pressure maybe set to reemerge. Bearish resumption initially targets the November 5 low at 1672.50.

Daily Chart - Created Using FXCM Marketscope 2.0
Want to learn more about RSI? Watch this Video.
CRUDE OIL TECHNICAL ANALYSIS– Prices moved lower as expected after putting in a Shooting Star candlestick. A bearish continuation Flag chart pattern now appears to be validated with a break through the setup’s lower boundary, initially exposing the 38.2% Fibonacci expansion at 84.04. A further push below that targets the 50% level at 82.13. Flag bottom support-turned-resistance is now at 85.94, with a reversal back above that aiming for the 23.6% Fib at 86.45.

Daily Chart - Created Using FXCM Marketscope 2.0
--- Written by Ilya Spivak, Currency Strategist for Dailyfx.com
To contact Ilya, e-mail ispivak@dailyfx.com. Follow Ilya on Twitter at @IlyaSpivak
To be added to Ilya's e-mail distribution list, please CLICK HERE
DailyFX provides forex news and technical analysis on the trends that influence the global currency markets.
Learn forex trading with a free practice account and trading charts from FXCM.
