
 Yahoo Finance
 Forex Analysis: US Dollar Chart Setup Hints at Rebound Ahead
THE TAKEAWAY: US Dollar technical positioning hints a recovery may be ahead after a period of consolidation, while the S&P 500 recovery may be running out of steam.
US DOLLAR TECHNICAL ANALYSIS– Prices are stalling at the bottom of a rising channel set from mid-September (now at 9965). An Inverted Hammer candlestick hints a rebound may be ahead. Near-term resistance is at 9993, the 23.6% Fibonacci retracement, with a push above that aiming to challenge the November 16 high at 10071. Alternatively, a break below support initially exposes the 38.2% level at 9945.
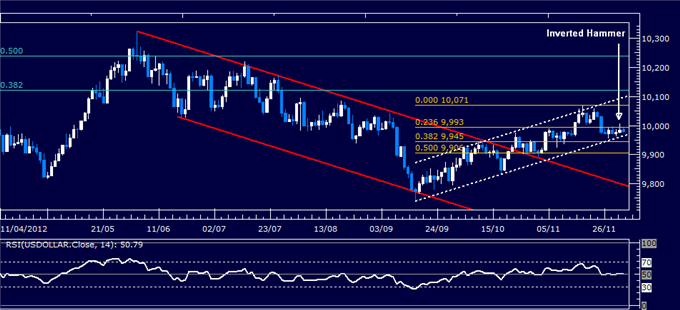
Daily Chart - Created Using FXCM Marketscope 2.0
S&P 500 TECHNICAL ANALYSIS – Prices edged above resistance at a falling trend line set from mid-October and overcame the 50% Fibonacci retracement at 1408.50. The bulls now aim to challenge the 1424.90-30.90 area, with a break above that exposing the 76.4% Fib at 1443.60. However, a Doji candlestick points to indecision and hints a pullback may be ahead. The 1408.50 level has been recast as near-term support, with a drop back below that exposing the trend line (now at 1398.70) and the 38.2% retracementat 1392.80.
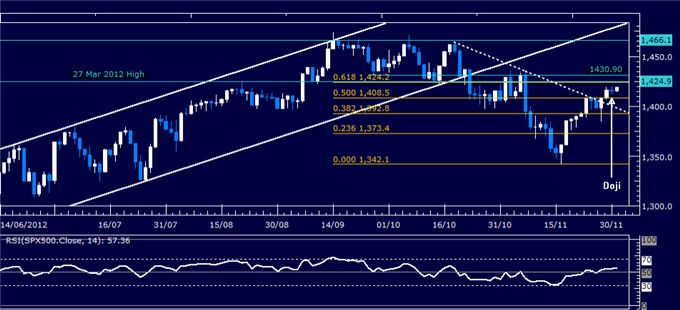
Daily Chart - Created Using FXCM Marketscope 2.0
GOLD TECHNICAL ANALYSIS – Prices turned lower after putting in a Bearish Engulfing candlestick pattern below the 61.8% Fibonacci retracement (1748.70), dropping past the 38.2% level at 1719.60. Sellers now target the 23.6% Fib at 1701.60, a barrier reinforced by a rising trend line set from late June (now at 1700.18). A push below that initially targets the November 5 low at 1672.50. The 1719.60 level has been recast as initial resistance, with a reversal back above that aiming for the 50% retracement at 1734.15.
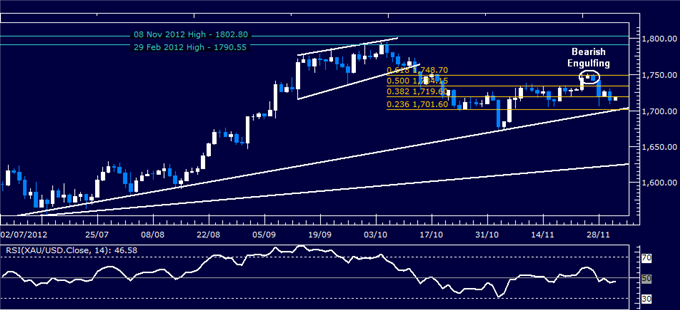
Daily Chart - Created Using FXCM Marketscope 2.0
Want to learn more about RSI? Watch this Video.
CRUDE OIL TECHNICAL ANALYSIS– Prices continue to consolidate below the 23.6% Fibonacci expansion at 89.48. Near-term support is at 84.104, the November 7 low, with a break below that exposing the 80-50-81.43 area. Alternatively, a push above resistance targets the 38.2% expansion at 92.87.
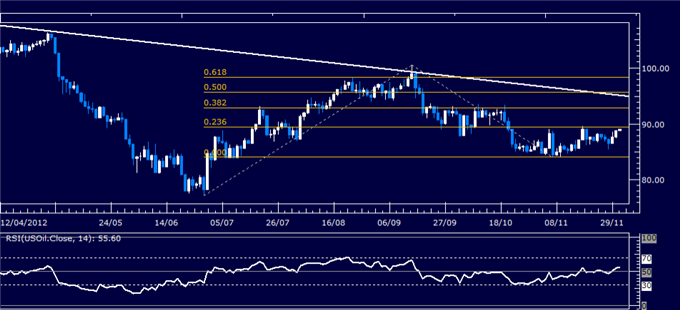
Daily Chart - Created Using FXCM Marketscope 2.0
--- Written by Ilya Spivak, Currency Strategist for Dailyfx.com
To contact Ilya, e-mail ispivak@dailyfx.com. Follow Ilya on Twitter at @IlyaSpivak
To be added to Ilya's e-mail distribution list, please CLICK HERE
DailyFX provides forex news and technical analysis on the trends that influence the global currency markets.
Learn forex trading with a free practice account and trading charts from FXCM.
