
 Yahoo Finance
 FOREX Analysis: Trading EUR/USD Short Early Next Week
Yellow Bars – JS Spike
Blue Bars – JS Thrust Up
Red Bars – JS Thrust Down
S&P 500
Weekly

Prepared by Jamie Saettele, CMT
Equity Observation: The decline this week is important because it comes just after a JS Thrust and break of the trendline that extends off of the 2011 and June 2012 lows. The action immediately after these technical events strongly suggests that the bearish break is valid. The top of the JS Thrust bar at 1433.38 is now the line in the sand for bears. 1371-1388 is now resistance. Estimated support is the JS Spike close from June at 1325.66.
Equity Trading Implication: Objective measures such as the Thrust bar and monthly opening range implications favor a bearish bias over the next several weeks (at least) but Friday’s reversal is consistent with price holding up for several days. The rally would consist of 2 equal legs from the low at 1369.11. This level is also defined by Wednesday congestion and is just below Tuesday’s low at 1371.39. I’ll be on the lookout for a top near 1370.
Dow Jones FXCM Dollar Index (Ticker: USDOLLAR)
Weekly

Prepared by Jamie Saettele, CMT
FOREX Observation: The USDOLLAR has broken through the 23.6% extension of the August 2011-June 2012 rally which shifts focus to the 50% extension at 10237. The August high and 61.8% retracement of the decline from the June high comes in just above Friday’s high.
FOREX Trading Implication: As long as the USDOLLAR is above the 11/12 low, look higher towards 10095. That level is unlikely to give way easily. Once it does, 10237 is in focus. Support is now 10010/30.
Euro / US Dollar
Weekly

Prepared by Jamie Saettele, CMT
FOREX Observation: The EUR/USD traded in a tight range this past week. The decline from Thursday’s high is telling in that it’s impulsive (5 waves). The implications are that the bounce from 12661 is complete at 12801. Early week resistance is 12759.
FOREX Trading Implication: I wrote last week that “strength above 12800, especially if on Monday, would present an opportunity to align with weakness against the November 1 high of 12981 for a test of 12607 (50% retracement) and potentially 12471 (61.8%).” 12800 traded but not until Thursday. As mentioned, the impulsive behavior of price action from Thursday’s high suggests that the downtrend has resumed. Although un expected, trading above Thursday’s high would shift focus to former supports at 12825 and 12882.
Australian Dollar / US Dollar
Weekly

Prepared by Jamie Saettele, CMT
FOREX Observation: Keeping in mind the longer term AUD/USD triangle, we should respect potential for another bear leg towards parity or below in order to complete triangle wave E…and probably from nearby levels.
FOREX Trading Implication: Market risk is lower against 10460. 10275 and 10192 are levels that the AUD/USD may respond to on an interim basis. Alternate triangle legs often relate to one another by a .618 multiple which in this case comes in at 9835. Again, pattern interpretation is fairly subjective but the 11/7 JS Spike is the objective trigger that leaves me bearish. 10360/86 is resistance.
US Dollar / Japanese Yen
Weekly
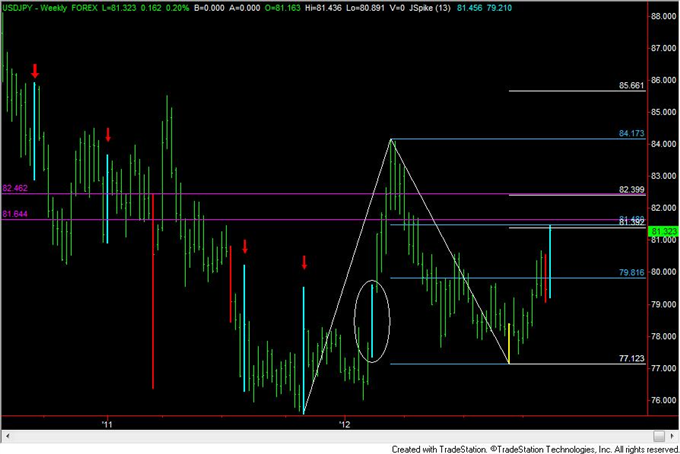
Prepared by Jamie Saettele, CMT
FOREX Technical Analysis Observation: The USD/JPY high Thursday was 8146, just 2 pips shy of the 61.8% retracement of the decline from March. Elliott wave channelling and Fibonacci relationships suggest that the current level is one of importance as well. Wave 5 is equal to 61.8% of waves 1 through 3 and price closed beneath the Elliott channel after trading through it intraday. A JS Thrust Up formed this week into the well-defined resistance. 4 of the last 5 weekly JS Thrust Ups have given way to weakness immediately. The February instance indicated a bullish breakout. An inside day occurred Friday and the rally from 7907 is either complete in 5 waves or will be with a final push to a slight new high.
FOREX Trading Implication: Friday’s inside day at resistance and after the completion of 5 waves at multiple degrees of trend suggests that risk is to the downside. A drop below 8089 would warrant a short position against the intervening high (8146 at this point).
Australian Dollar / Japanese Yen
Weekly
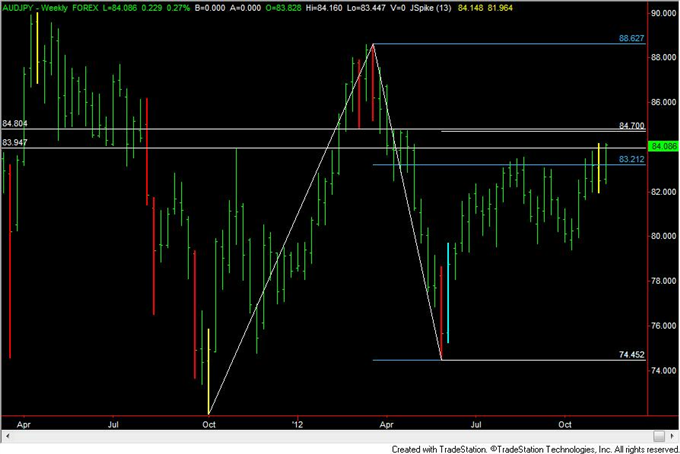
Prepared by Jamie Saettele, CMT
FOREX Technical Analysis Observation: The AUD/JPY traded a pip above last week’s high to trade at its highest level since April 27th. Measured levels along with the March low and pivots from April at 8470/80 is the next area that may produce a response. The JS Spike from 2 weeks ago (week that ended 11/9) has yet to be confirmed. Divergence with RSI is worth noting on the daily (RSI is below 70 as well).
FOREX Trading Implication: Resistance just shy of 8500 and mentioned divergence suggest that the market is vulnerable but a drop below 8344 or setup at slightly higher levels is needed in order to trade from the short side. At this point, a short is a shot in the dark.
--- Written by Jamie Saettele, CMT, Senior Technical Strategist for DailyFX.com
To contact Jamie e-mail jsaettele@dailyfx.com. Follow him on Twitter @JamieSaettele
Subscribe to Jamie Saettele's distribution list in order to receive actionable FX trading strategy delivered to your inbox once a day.
Jamie is the author of Sentiment in the Forex Market.
DailyFX provides forex news and technical analysis on the trends that influence the global currency markets.
Learn forex trading with a free practice account and trading charts from FXCM.
