
 Yahoo Finance
 Forex Analysis: Japanese Yen Breaks ¥91, How Can we Trade It?
The Japanese Yen continued to tumble versus the US Dollar and has fallen to fresh multi-year lows. How much further can the USDJPY rally, and how can we trade it?
Japanese Yen Tumbles to Fresh Multi-Year Low Versus US Dollar

Source: FXCM Trading Station Desktop, Prepared by David Rodriguez
We first called for a substantive Japanese Yen top (USDJPY bottom) in August of 2012 as extremely one-sided sentiment warned that an important turning point was near.
Since then, the opposite may have occurred: forex trader sentiment warns that the Japanese Yen may be near an important short-term bottom (USDJPY top). Why exactly?
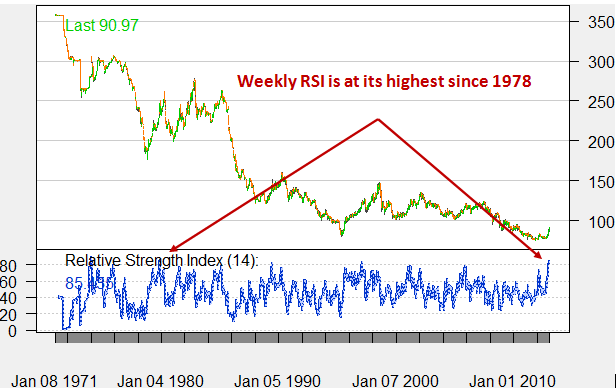
Pure price action shows that the Relative Strength Index on the USDJPY weekly chart is now at its most overbought in 35 years—an almost-incredible statistic. The popular RSI indicator ranges from 0 to 100, and most consider that any values below 30 show that a currency is oversold while a climb above 70 shows that markets are overbought.
The weekly USDJPY chart had previously gone into overbought territory a mere two times in the past 10 years. Following each of those instances, the currency pair rallied further to significant highs before seeing substantial corrections—most recently in March, 2012 when the USDJPY fell from ¥84 to ¥78 within two months.
US Dollar/Japanese Yen Relative Strength Index Highest Since 1978
Yet timing such a reversal is incredibly difficult, and indeed many remain positioned for further Japanese Yen weakness (USDJPY strength). Recent CFTC Commitment of Traders data underlines this point: large speculative futures traders are near their most net-short JPY (long USDJPY) since the pair traded above ¥120 in 2007. FX Options traders near their most bullish USDJPY since at least 2003.
Japanese Yen Futures and Options Sentiment at Substantial Bearish Extremes
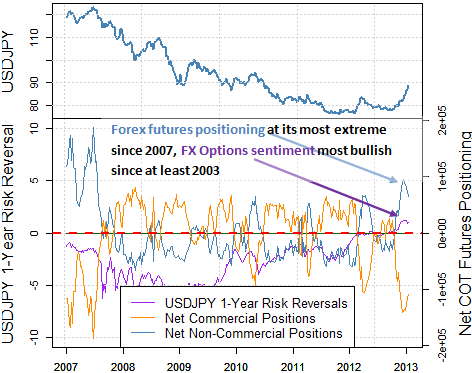
Source: CFTC Commitment of Traders Report, Over the Counter Options Data
We see similar positioning extremes in our proprietary FXCM Speculative Sentiment Index data, which measures retail forex trading sentiment. The SSI shows that the total number of open orders short the USDJPY is at its highest since on record. Indeed, traders are now net-short the USDJPY for the longest stretch since the pair last traded above ¥90 in 2010.
Retail Forex Traders Extremely Long the Japanese Yen (Short USDJPY)
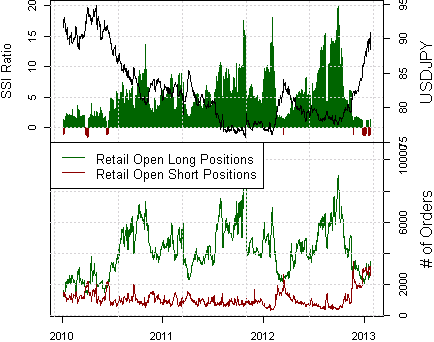
Source: FXCM Speculative Sentiment Index, watch a video on the SSI
What does this all mean? In our opinion such incredible swings in price action and trader positioning/sentiment underline the fact that we have set a substantive USDJPY bottom (Japanese Yen top) and are likely to continue higher.
Yet the risk of sharp Yen reversal is particularly high, and we warn against chasing USDJPY gains without proper money management. Our Senior Technical Strategist expects that the USDJPY could test ¥91.59 and ¥92.42 through near-term trading. Short-term support rests at ¥90.24 and ¥89.45.
Our real forex trader data emphasizes that many traders are willing to risk far more than they stand to gain in their trades. If traders look to buy USDJPY strength, we suggest that their profit potential be at least as large as their maximum risk.
USDJPY Technical Support and Resistance Levels Outline Potential Trade
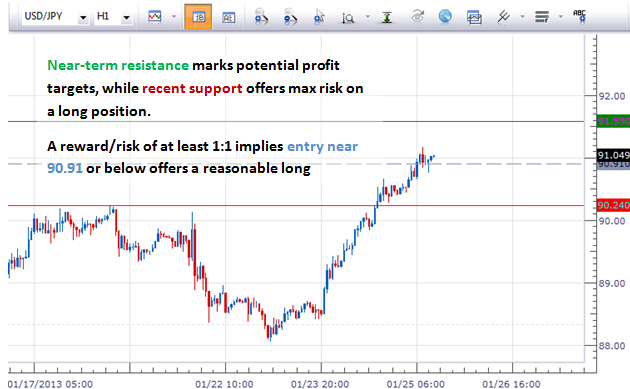
Source: FXCM Trading Station Desktop, Prepared by David Rodriguez
If we take short-term support at 90.24 as maximum risk levels and 91.59 as a potential profit target, this implies that USDJPY long entries at 90.91 or lower offer reasonable short-term trading opportunities.
Yet we must emphasize that traders should not simply go long USDJPY without proper risk management in place: the potential for a pronounced Japanese Yen correction is simply too great. Traders should remain wary as a substantial USDJPY reversal seems imminent, but timing such moves remains extremely difficult.
--- Written by David Rodriguez, Quantitative Strategist for DailyFX.com
To receive the Speculative Sentiment Index and other reports from this author via e-mail, sign up for his distribution list via this link.
New to FX markets? Learn more in our video trading guide.
Contact David via
Twitter at http://www.twitter.com/DRodriguezFX
Facebook at http://www.Facebook.com/DRodriguezFX
DailyFX provides forex news and technical analysis on the trends that influence the global currency markets.
Learn forex trading with a free practice account and trading charts from FXCM.
