
 Yahoo Finance
 Forex Analysis: Dollar Hits One-Month High as S&P 500 Resumes Selloff
THE TAKEAWAY: The US Dollar hit a one-month high while the S&P 500 broke support guiding the upswing since mid-November, hinting the larger selloff as resumed.
US DOLLAR TECHNICAL ANALYSIS– Prices are testing above resistance at 10044, the 32.8%Fibonacci expansion, after completing a bullish Flag chart pattern. A break higher exposes the 50% level at 10082. Near-term support is at 9995, the 23.6% Fib, with a drop below that aiming for trend line resistance-turned-support at 9967.
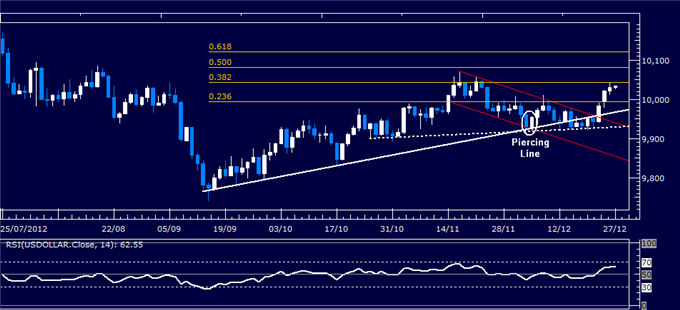
Daily Chart - Created Using FXCM Marketscope 2.0
S&P 500 TECHNICAL ANALYSIS – Prices broke down as expected after putting in a bearish Dark Cloud Cover candlestick pattern below falling trend line resistance set from the September 14 high. Sellers have now overcome rising channel support and the 23.6% Fibonacci retracement at 1424.60, exposing the 38.2% level at 1408.80. The 1424.60 level and the channel bottom (now at 1427.80) have been recast as near-term resistance.
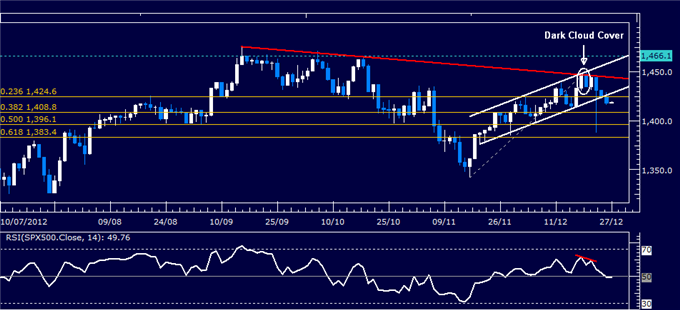
Daily Chart - Created Using FXCM Marketscope 2.0
GOLD TECHNICAL ANALYSIS – Prices mounted a shallow recovery from support at 1630.97, marked by the 100% Fibonacci expansion and reinforced by the bottom of a falling channel set from mid-September.The 76.4% expansion at 1659.90 is acting as near-term resistance, with a move above that targeting the 61.8% mark at 1677.84. Alternatively, a reversal below 1630.97 aims for the 123.6% Fib at 1601.78.
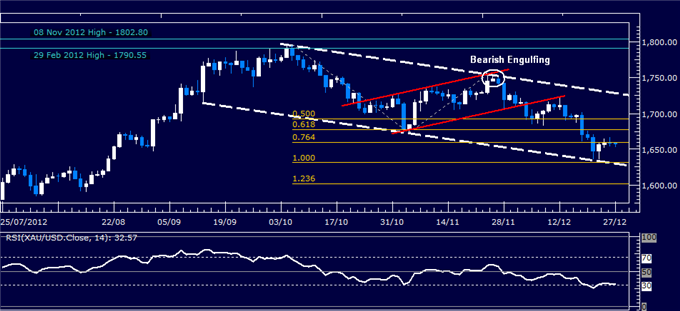
Daily Chart - Created Using FXCM Marketscope 2.0
Want to learn more about RSI? Watch this Video.
CRUDE OIL TECHNICAL ANALYSIS– Prices are testing resistance at 91.23, the intersection of the 61.8% Fibonacci expansion and the top of a rising channel set from early November. A break higher targets the 76.4% level at 92.01. Support is at 90.59, the 50% Fib, with a drop below that exposing the 38.2% expansion at 89.98.
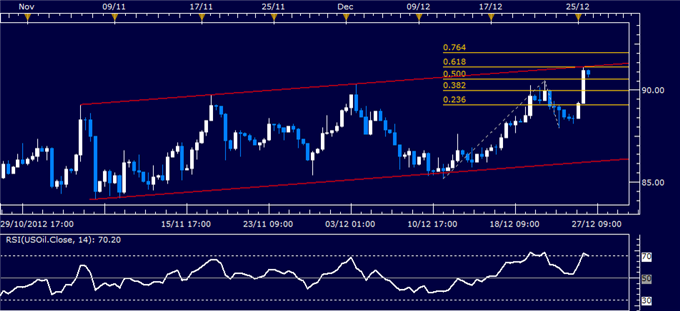
8hr Chart - Created Using FXCM Marketscope 2.0
--- Written by Ilya Spivak, Currency Strategist for Dailyfx.com
To contact Ilya, e-mail ispivak@dailyfx.com. Follow Ilya on Twitter at @IlyaSpivak
To be added to Ilya's e-mail distribution list, please CLICK HERE
DailyFX provides forex news and technical analysis on the trends that influence the global currency markets.
Learn forex trading with a free practice account and trading charts from FXCM.
