
 Yahoo Finance
 Are Far East Orchard Limited’s (SGX:O10) Interest Costs Too High?

Far East Orchard Limited (SGX:O10) is a small-cap stock with a market capitalization of S$616.44M. While investors primarily focus on the growth potential and competitive landscape of the small-cap companies, they end up ignoring a key aspect, which could be the biggest threat to its existence: its financial health. Why is it important? Evaluating financial health as part of your investment thesis is essential, since poor capital management may bring about bankruptcies, which occur at a higher rate for small-caps. Here are few basic financial health checks you should consider before taking the plunge. Though, this commentary is still very high-level, so I suggest you dig deeper yourself into O10 here.
Does O10 generate enough cash through operations?
O10 has sustained its debt level by about S$360.86M over the last 12 months – this includes both the current and long-term debt. At this current level of debt, O10 currently has S$219.59M remaining in cash and short-term investments for investing into the business. On top of this, O10 has produced cash from operations of S$8.90M over the same time period, resulting in an operating cash to total debt ratio of 2.47%, meaning that O10’s debt is not appropriately covered by operating cash. This ratio can also be interpreted as a measure of efficiency as an alternative to return on assets. In O10’s case, it is able to generate 0.025x cash from its debt capital.
Does O10’s liquid assets cover its short-term commitments?
At the current liabilities level of S$310.70M liabilities, it appears that the company has been able to meet these obligations given the level of current assets of S$402.46M, with a current ratio of 1.3x. For Real Estate companies, this ratio is within a sensible range as there’s enough of a cash buffer without holding too capital in low return investments.
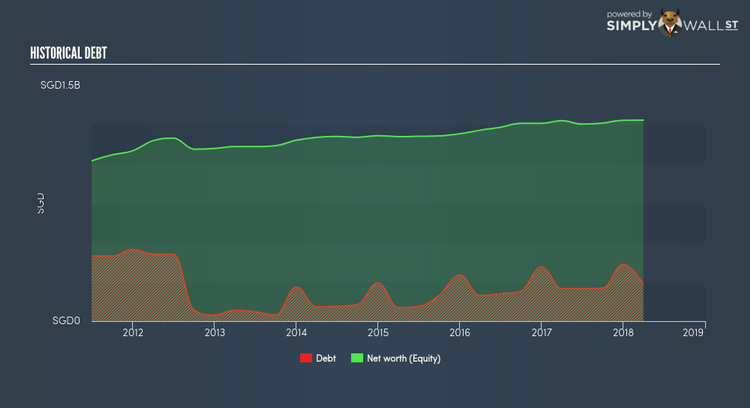
Does O10 face the risk of succumbing to its debt-load?
With debt at 18.46% of equity, O10 may be thought of as appropriately levered. This range is considered safe as O10 is not taking on too much debt obligation, which may be constraining for future growth. We can test if O10’s debt levels are sustainable by measuring interest payments against earnings of a company. Ideally, earnings before interest and tax (EBIT) should cover net interest by at least three times. For O10, the ratio of 10.72x suggests that interest is comfortably covered, which means that lenders may be inclined to lend more money to the company, as it is seen as safe in terms of payback.
Next Steps:
O10’s low debt is also met with low coverage. This indicates room for improvement as its cash flow covers less than a quarter of its borrowings, which means its operating efficiency could be better. However, the company exhibits proper management of current assets and upcoming liabilities. This is only a rough assessment of financial health, and I’m sure O10 has company-specific issues impacting its capital structure decisions. I recommend you continue to research Far East Orchard to get a more holistic view of the stock by looking at:
Valuation: What is O10 worth today? Is the stock undervalued, even when its growth outlook is factored into its intrinsic value? The intrinsic value infographic in our free research report helps visualize whether O10 is currently mispriced by the market.
Historical Performance: What has O10’s returns been like over the past? Go into more detail in the past track record analysis and take a look at the free visual representations of our analysis for more clarity.
Other High-Performing Stocks: Are there other stocks that provide better prospects with proven track records? Explore our free list of these great stocks here.
To help readers see pass the short term volatility of the financial market, we aim to bring you a long-term focused research analysis purely driven by fundamental data. Note that our analysis does not factor in the latest price sensitive company announcements.
The author is an independent contributor and at the time of publication had no position in the stocks mentioned.
