How Far $650K Plus Social Security Will Go in Every State

Once you finally get to stop working, it shouldn’t be a full-time job figuring out how to finagle your finances to stretch your Roth IRA, 401(k), pension, Social Security and other retirement savings throughout your golden years. Whatever you have set aside for your retirement years will be greatly impacted by how you’ve invested your money and the location where you choose to retire.
When it comes to this specific retirement calculus, the aim is to live better and not worry about whether you’ll live longer. Depending on when you retire, and at what age, your Social Security income will vary, so it’s good to have a separate nest egg. Having at least $650,000 saved in other retirement accounts may seem like a big sum of money, but how long will it last you?
Find Out: 7 Reasons You Shouldn’t Retire Before Speaking To a Financial Advisor
Read Next: 8 States To Move to If You Don’t Want To Pay Taxes on Social Security
GOBankingRates recently did a study to determine how long $650,000 plus your Social Security benefits would last you in retirement in every state based on such factors as median household income, average home value, mortgage payments and cost of living. States were then ranked by the longest amount of time to draw down $650,000 in savings to the shortest.
Also see how much retirement savings you need to retire in each state.

West Virginia
Total population: 1,775,156
Percentage of population aged 65 and older: 21.2%
Average monthly cost of living: $2,814
Total monthly cost of living after Social Security: $946
Average annual cost of living: $33,767
Total annual cost of living after Social Security: $11,353
Years to draw down $650,000 in retirement savings: 57.25
Be Aware: How Long $1 Million in Retirement Will Last in Every State
Learn More: Cutting Expenses for Retirement? Here’s the No. 1 Thing To Get Rid of First
Earning passive income doesn't need to be difficult. You can start this week.

Mississippi
Total population: 2,940,057
Percentage of population aged 65 and older: 17.5%
Average monthly cost of living: $2,847
Total monthly cost of living after Social Security: $979
Average annual cost of living: $34,161
Total annual cost of living after Social Security: $11,748
Years to draw down $650,000 in retirement savings: 55.33
Try This: I’m a Retired Boomer: Here Are 3 Debts You Should Definitely Pay Off Before Retirement

Arkansas
Total population: 3,045,637
Percentage of population aged 65 and older: 17.7%
Average monthly cost of living: $2,925
Total monthly cost of living after Social Security: $1,058
Average annual cost of living: $35,105
Total annual cost of living after Social Security: $12,691
Years to draw down $650,000 in retirement savings: 51.22

Louisiana
Total population: 4,590,241
Percentage of population aged 65 and older: 17.0%
Average monthly cost of living: $2,930
Total monthly cost of living after Social Security: $1,062
Average annual cost of living: $35,156
Total annual cost of living after Social Security: $12,742
Years to draw down $650,000 in retirement savings: 51.01

Oklahoma
Total population: 4,019,800
Percentage of population aged 65 and older: 16.5%
Average monthly cost of living: $2,997
Total monthly cost of living after Social Security: $1,129
Average annual cost of living: $35,966
Total annual cost of living after Social Security: $13,552
Years to draw down $650,000 in retirement savings: 47.96

Alabama
Total population: 5,074,296
Percentage of population aged 65 and older: 18.0%
Average monthly cost of living: $3,084
Total monthly cost of living after Social Security: $1,217
Average annual cost of living: $37,012
Total annual cost of living after Social Security: $14,598
Years to draw down $650,000 in retirement savings: 44.53
Trending Now: 3 Reasons You Should Not Buy a House When You Retire

Kentucky
Total population: 4,512,310
Percentage of population aged 65 and older: 17.5%
Average monthly cost of living: $3,091
Total monthly cost of living after Social Security: $1,223
Average annual cost of living: $37,088
Total annual cost of living after Social Security: $14,674
Years to draw down $650,000 in retirement savings: 44.30
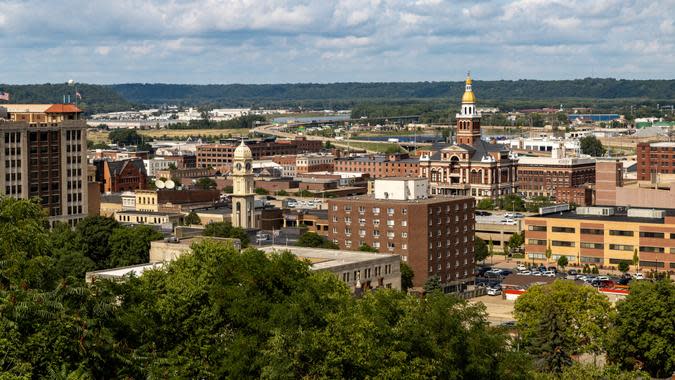
Iowa
Total population: 3,200,517
Percentage of population aged 65 and older: 18.4%
Average monthly cost of living: $3,131
Total monthly cost of living after Social Security: $1,263
Average annual cost of living: $37,573
Total annual cost of living after Social Security: $15,159
Years to draw down $650,000 in retirement savings: 42.88
Kansas
Total population: 2,937,150
Percentage of population aged 65 and older: 17.2%
Average monthly cost of living: $3,142
Total monthly cost of living after Social Security: $1,274
Average annual cost of living: $37,699
Total annual cost of living after Social Security: $15,285
Years to draw down $650,000 in retirement savings: 42.52

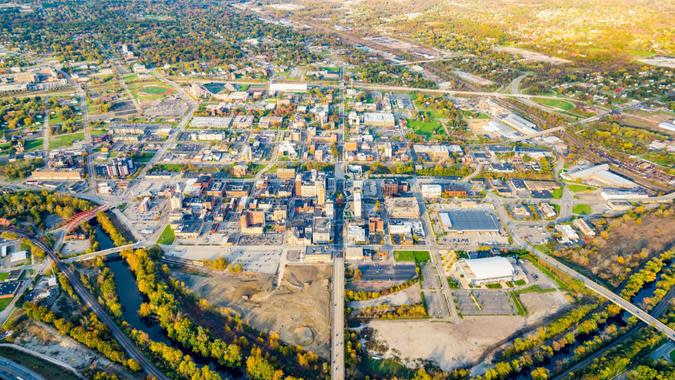
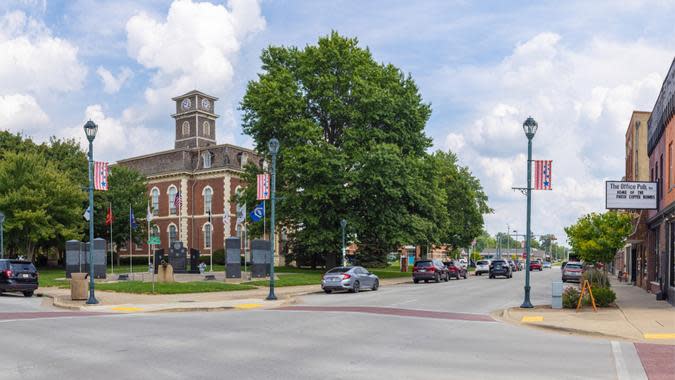
Missouri
Total population: 6,177,957
Percentage of population aged 65 and older: 18.0%
Average monthly cost of living: $3,205
Total monthly cost of living after Social Security: $1,337
Average annual cost of living: $38,455
Total annual cost of living after Social Security: $16,041
Years to draw down $650,000 in retirement savings: 40.52
Check Out: I’m an Economist: Here’s My Prediction for Social Security If Trump Wins the 2024 Election
Ohio
Total population: 11,756,058
Percentage of population aged 65 and older: 18.4%
Average monthly cost of living: $3,212
Total monthly cost of living after Social Security: $1,344
Average annual cost of living: $38,541
Total annual cost of living after Social Security: $16,127
Years to draw down $650,000 in retirement savings: 40.31

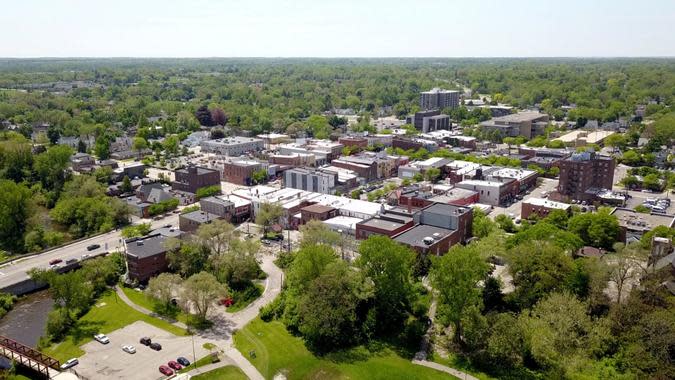
Indiana
Total population: 6,833,037
Percentage of population aged 65 and older: 16.9%
Average monthly cost of living: $3,230
Total monthly cost of living after Social Security: $1,362
Average annual cost of living: $38,758
Total annual cost of living after Social Security: $16,344
Years to draw down $650,000 in retirement savings: 39.77
Michigan
Total population: 10,034,118
Percentage of population aged 65 and older: 18.7%
Average monthly cost of living: $3,259
Total monthly cost of living after Social Security: $1,392
Average annual cost of living: $39,113
Total annual cost of living after Social Security: $16,699
Years to draw down $650,000 in retirement savings: 38.92
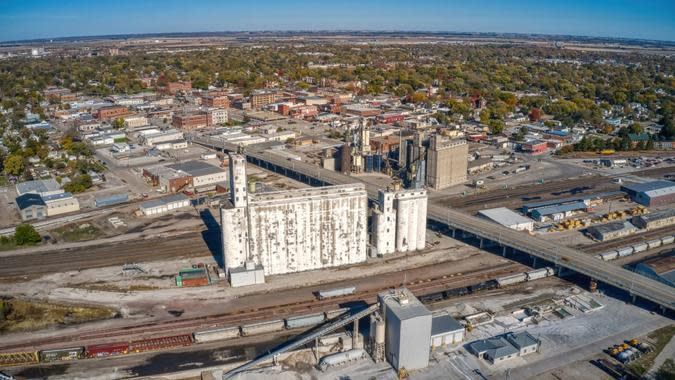
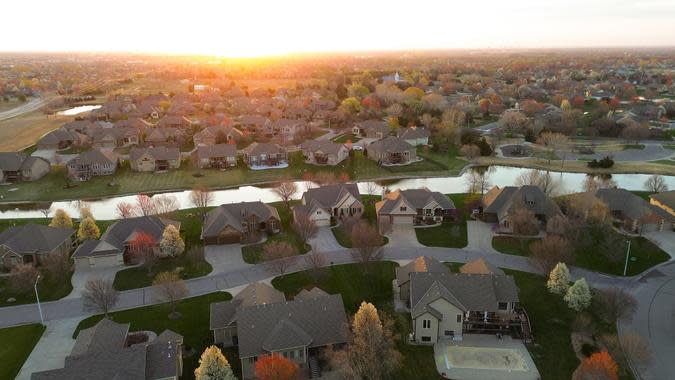
Nebraska
Total population: 1,967,923
Percentage of population aged 65 and older: 17.0%
Average monthly cost of living: $3,388
Total monthly cost of living after Social Security: $1,521
Average annual cost of living: $40,662
Total annual cost of living after Social Security: $18,248
Years to draw down $650,000 in retirement savings: 35.62
For You: 5 Reasons Retirees Regret Selling Their Homes in Retirement

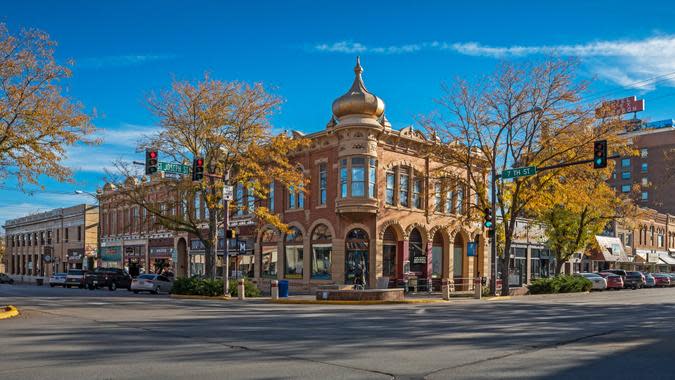
North Dakota
Total population: 779,261
Percentage of population aged 65 and older: 16.7%
Average monthly cost of living: $3,425
Total monthly cost of living after Social Security: $1,557
Average annual cost of living: $41,094
Total annual cost of living after Social Security: $18,680
Years to draw down $650,000 in retirement savings: 34.80

Pennsylvania
Total population: 12,972,008
Percentage of population aged 65 and older: 19.6%
Average monthly cost of living: $3,433
Total monthly cost of living after Social Security: $1,565
Average annual cost of living: $41,194
Total annual cost of living after Social Security: $18,780
Years to draw down $650,000 in retirement savings: 34.61
Illinois
Total population: 12,582,032
Percentage of population aged 65 and older: 17.2%
Average monthly cost of living: $3,457
Total monthly cost of living after Social Security: $1,589
Average annual cost of living: $41,485
Total annual cost of living after Social Security: $19,072
Years to draw down $650,000 in retirement savings: 34.08

New Mexico
Total population: 2,113,344
Percentage of population aged 65 and older: 19.2%
Average monthly cost of living: $3,580
Total monthly cost of living after Social Security: $1,712
Average annual cost of living: $42,963
Total annual cost of living after Social Security: $20,549
Years to draw down $650,000 in retirement savings: 31.63
Explore More: I’m an Economist: Here’s My Prediction for Social Security If Kamala Harris Wins the Election

Tennessee
Total population: 7,051,339
Percentage of population aged 65 and older: 17.3%
Average monthly cost of living: $3,612
Total monthly cost of living after Social Security: $1,744
Average annual cost of living: $43,343
Total annual cost of living after Social Security: $20,929
Years to draw down $650,000 in retirement savings: 31.06

South Carolina
Total population: 5,282,634
Percentage of population aged 65 and older: 19.1%
Average monthly cost of living: $3,618
Total monthly cost of living after Social Security: $1,750
Average annual cost of living: $43,417
Total annual cost of living after Social Security: $21,003
Years to draw down $650,000 in retirement savings: 30.95

Texas
Total population: 30,029,572
Percentage of population aged 65 and older: 13.4%
Average monthly cost of living: $3,625
Total monthly cost of living after Social Security: $1,758
Average annual cost of living: $43,505
Total annual cost of living after Social Security: $21,091
Years to draw down $650,000 in retirement savings: 30.82
South Dakota
Total population: 909,824
Percentage of population aged 65 and older: 18.2%
Average monthly cost of living: $3,641
Total monthly cost of living after Social Security: $1,773
Average annual cost of living: $43,696
Total annual cost of living after Social Security: $21,282
Years to draw down $650,000 in retirement savings: 30.54
Read More: What a Middle-Class Social Security Check Could Look Like in 2025

Wisconsin
Total population: 5,892,539
Percentage of population aged 65 and older: 18.7%
Average monthly cost of living: $3,738
Total monthly cost of living after Social Security: $1,870
Average annual cost of living: $44,850
Total annual cost of living after Social Security: $22,436
Years to draw down $650,000 in retirement savings: 28.97

Georgia
Total population: 10,912,876
Percentage of population aged 65 and older: 15.1%
Average monthly cost of living: $3,799
Total monthly cost of living after Social Security: $1,931
Average annual cost of living: $45,584
Total annual cost of living after Social Security: $23,171
Years to draw down $650,000 in retirement savings: 28.05

North Carolina
Total population: 10,698,973
Percentage of population aged 65 and older: 17.4%
Average monthly cost of living: $3,855
Total monthly cost of living after Social Security: $1,987
Average annual cost of living: $46,260
Total annual cost of living after Social Security: $23,846
Years to draw down $650,000 in retirement savings: 27.26

Wyoming
Total population: 581,381
Percentage of population aged 65 and older: 18.6%
Average monthly cost of living: $3,857
Total monthly cost of living after Social Security: $1,990
Average annual cost of living: $46,288
Total annual cost of living after Social Security: $23,874
Years to draw down $650,000 in retirement savings: 27.23
Discover More: Here Are All the Promises Trump Has Made About Social Security If He’s Reelected

Minnesota
Total population: 5,717,184
Percentage of population aged 65 and older: 17.4%
Average monthly cost of living: $3,916
Total monthly cost of living after Social Security: $2,049
Average annual cost of living: $46,997
Total annual cost of living after Social Security: $24,583
Years to draw down $650,000 in retirement savings: 26.44

Delaware
Total population: 1,018,396
Percentage of population aged 65 and older: 20.8%
Average monthly cost of living: $4,192
Total monthly cost of living after Social Security: $2,324
Average annual cost of living: $50,302
Total annual cost of living after Social Security: $27,888
Years to draw down $650,000 in retirement savings: 23.31

Virginia
Total population: 8,683,619
Percentage of population aged 65 and older: 16.8%
Average monthly cost of living: $4,216
Total monthly cost of living after Social Security: $2,348
Average annual cost of living: $50,587
Total annual cost of living after Social Security: $28,173
Years to draw down $650,000 in retirement savings: 23.07
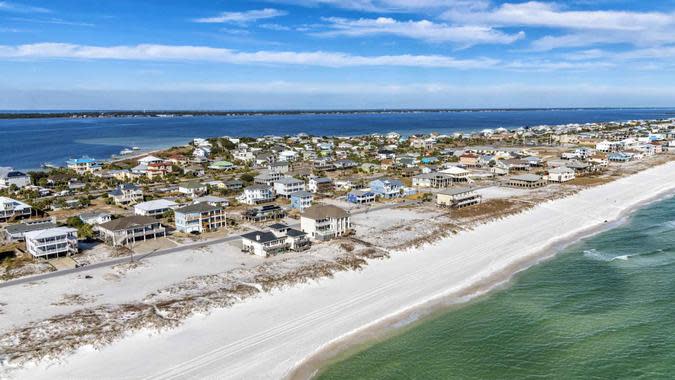
Florida
Total population: 22,244,823
Percentage of population aged 65 and older: 21.6%
Average monthly cost of living: $4,364
Total monthly cost of living after Social Security: $2,496
Average annual cost of living: $52,370
Total annual cost of living after Social Security: $29,956
Years to draw down $650,000 in retirement savings: 21.70
Check Out: The Standard Retirement Age in the US vs. 5 European Countries

Vermont
Total population: 647,064
Percentage of population aged 65 and older: 21.6%
Average monthly cost of living: $4,392
Total monthly cost of living after Social Security: $2,524
Average annual cost of living: $52,703
Total annual cost of living after Social Security: $30,289
Years to draw down $650,000 in retirement savings: 21.46

Maine
Total population: 1,385,340
Percentage of population aged 65 and older: 22.6%
Average monthly cost of living: $4,441
Total monthly cost of living after Social Security: $2,573
Average annual cost of living: $53,293
Total annual cost of living after Social Security: $30,879
Years to draw down $650,000 in retirement savings: 21.05
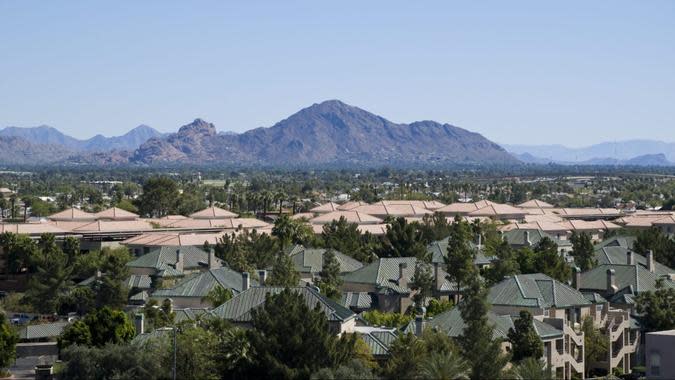
Arizona
Total population: 7,359,197
Percentage of population aged 65 and older: 18.8%
Average monthly cost of living: $4,469
Total monthly cost of living after Social Security: $2,601
Average annual cost of living: $53,626
Total annual cost of living after Social Security: $31,212
Years to draw down $650,000 in retirement savings: 20.83

Maryland
Total population: 6,164,660
Percentage of population aged 65 and older: 16.9%
Average monthly cost of living: $4,501
Total monthly cost of living after Social Security: $2,633
Average annual cost of living: $54,011
Total annual cost of living after Social Security: $31,597
Years to draw down $650,000 in retirement savings: 20.57
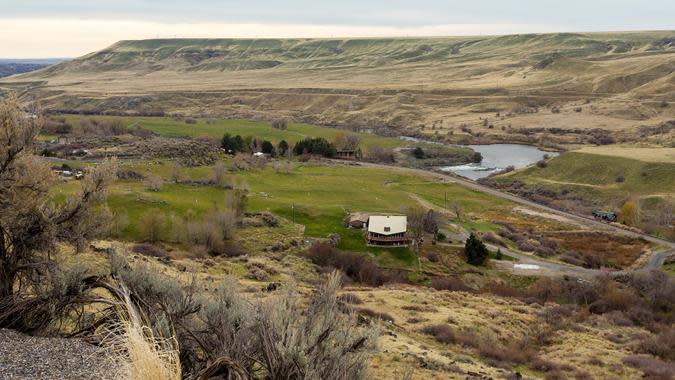
Idaho
Total population: 1,939,033
Percentage of population aged 65 and older: 17.0%
Average monthly cost of living: $4,544
Total monthly cost of living after Social Security: $2,676
Average annual cost of living: $54,528
Total annual cost of living after Social Security: $32,114
Years to draw down $650,000 in retirement savings: 20.24

Nevada
Total population: 3,177,772
Percentage of population aged 65 and older: 16.9%
Average monthly cost of living: $4,614
Total monthly cost of living after Social Security: $2,746
Average annual cost of living: $55,365
Total annual cost of living after Social Security: $32,951
Years to draw down $650,000 in retirement savings: 19.73
New York
Total population: 19,677,151
Percentage of population aged 65 and older: 18.1%
Average monthly cost of living: $4,645
Total monthly cost of living after Social Security: $2,777
Average annual cost of living: $55,735
Total annual cost of living after Social Security: $33,321
Years to draw down $650,000 in retirement savings: 19.51

Connecticut
Total population: 3,626,205
Percentage of population aged 65 and older: 18.3%
Average monthly cost of living: $4,655
Total monthly cost of living after Social Security: $2,787
Average annual cost of living: $55,856
Total annual cost of living after Social Security: $33,442
Years to draw down $650,000 in retirement savings: 19.44
Try This: Here’s the Income Needed To Be in the Top 1% in All 50 States

Montana
Total population: 1,122,867
Percentage of population aged 65 and older: 20.1%
Average monthly cost of living: $4,670
Total monthly cost of living after Social Security: $2,802
Average annual cost of living: $56,041
Total annual cost of living after Social Security: $33,627
Years to draw down $650,000 in retirement savings: 19.33
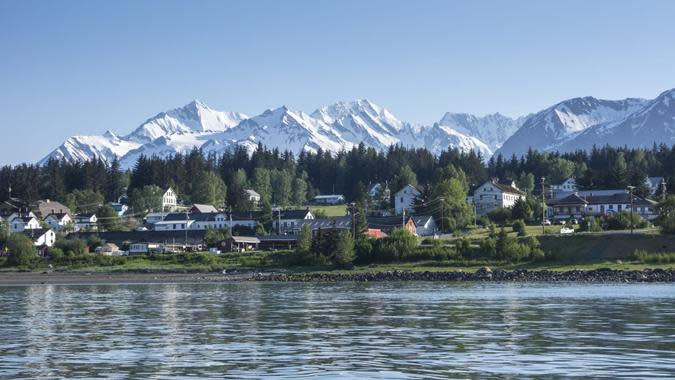
Alaska
Total population: 733,583
Percentage of population aged 65 and older: 13.8%
Average monthly cost of living: $4,788
Total monthly cost of living after Social Security: $2,920
Average annual cost of living: $57,456
Total annual cost of living after Social Security: $35,042
Years to draw down $650,000 in retirement savings: 18.55

Rhode Island
Total population: 1,093,734
Percentage of population aged 65 and older: 18.8%
Average monthly cost of living: $4,891
Total monthly cost of living after Social Security: $3,023
Average annual cost of living: $58,694
Total annual cost of living after Social Security: $36,280
Years to draw down $650,000 in retirement savings: 17.92

Utah
Total population: 3,380,800
Percentage of population aged 65 and older: 11.9%
Average monthly cost of living: $4,901
Total monthly cost of living after Social Security: $3,033
Average annual cost of living: $58,808
Total annual cost of living after Social Security: $36,394
Years to draw down $650,000 in retirement savings: 17.86
Be Aware: Kamala Harris’ Platform: How Her Plan for Social Security and Medicare Could Impact Your Finances

New Hampshire
Total population: 1,395,231
Percentage of population aged 65 and older: 20.2%
Average monthly cost of living: $4,950
Total monthly cost of living after Social Security: $3,082
Average annual cost of living: $59,397
Total annual cost of living after Social Security: $36,983
Years to draw down $650,000 in retirement savings: 17.58
Oregon
Total population: 4,240,137
Percentage of population aged 65 and older: 19.3%
Average monthly cost of living: $5,032
Total monthly cost of living after Social Security: $3,165
Average annual cost of living: $60,390
Total annual cost of living after Social Security: $37,976
Years to draw down $650,000 in retirement savings: 17.12

Colorado
Total population: 5,839,926
Percentage of population aged 65 and older: 15.7%
Average monthly cost of living: $5,153
Total monthly cost of living after Social Security: $3,285
Average annual cost of living: $61,833
Total annual cost of living after Social Security: $39,419
Years to draw down $650,000 in retirement savings: 16.49

New Jersey
Total population: 9,261,699
Percentage of population aged 65 and older: 17.4%
Average monthly cost of living: $5,196
Total monthly cost of living after Social Security: $3,328
Average annual cost of living: $62,351
Total annual cost of living after Social Security: $39,937
Years to draw down $650,000 in retirement savings: 16.28
Explore More: Here’s the Salary Needed to Actually Take Home $100K in Every State

Washington
Total population: 7,785,786
Percentage of population aged 65 and older: 16.8%
Average monthly cost of living: $5,717
Total monthly cost of living after Social Security: $3,849
Average annual cost of living: $68,602
Total annual cost of living after Social Security: $46,188
Years to draw down $650,000 in retirement savings: 14.07
Massachusetts
Total population: 6,981,974
Percentage of population aged 65 and older: 18.0%
Average monthly cost of living: $6,128
Total monthly cost of living after Social Security: $4,261
Average annual cost of living: $73,540
Total annual cost of living after Social Security: $51,126
Years to draw down $650,000 in retirement savings: 12.71

California
Total population: 39,029,342
Percentage of population aged 65 and older: 15.8%
Average monthly cost of living: $7,009
Total monthly cost of living after Social Security: $5,141
Average annual cost of living: $84,110
Total annual cost of living after Social Security: $61,696
Years to draw down $650,000 in retirement savings: 10.54

Hawaii
Total population: 1,440,196
Percentage of population aged 65 and older: 20.5%
Average monthly cost of living: $8,365
Total monthly cost of living after Social Security: $6,497
Average annual cost of living: $100,380
Total annual cost of living after Social Security: $77,966
Years to draw down $650,000 in retirement savings: 8.34
Methodology: For this study, GOBankingRates analyzed each U.S. state to find how far $650,000 and Social Security benefits will go in every state. First, GOBankingRates found information on each state, including total population, population ages 65 and over, median household income and total households, all sourced from the U.S. Census American Community Survey, the average single-family home value on June 2024 from Zillow Home Value Index and assuming a 10% down payment and using the national average 30-year fixed mortgage rate as sourced from the Federal Reserve Economic Data, the average mortgage cost can be calculated. The cost-of-living indexes were sourced from the Missouri Economic Research Information Center, and using the national average expenditure costs for residents aged 65 and over, as sourced from the Bureau of Labor Statistics Consumer Expenditure Survey, the average expenditure costs can be calculated. The expenditure costs and mortgage cost can be used to calculated the total cost of living. Using the average full Social Security income for residents ages 65 and over, as sourced from the Social Security Administration, the cost of living after Social Security benefits can be calculated. Assuming $650,000 in savings, the years to drawdown the savings account can be calculated using the total cost of living after Social Security benefits. Washington, D.C., was included as supplemental information. The states are sorted to show the longest amount of time to drawdown $650,000 in savings. All data was collected on and is up to date as of August 6, 2024.
More From GOBankingRates
What a Trump Presidency Could Mean for Social Security in 2025
These 10 Used Cars Will Last Longer Than an Average New Vehicle
Shop Online? Here's How to Get 3% Cash Back For Things You Already Buy
6 Subtly Genius Things All Wealthy People Do With Their Money -- That You Should Do, Too
This article originally appeared on GOBankingRates.com: How Far $650K Plus Social Security Will Go in Every State