
 Yahoo Finance
 Are Express Scripts Holding Company’s (NASDAQ:ESRX) Interest Costs Too High?

Express Scripts Holding Company (NASDAQ:ESRX), a large-cap worth US$45.26b, comes to mind for investors seeking a strong and reliable stock investment. Big corporations are much sought after by risk-averse investors who find diversified revenue streams and strong capital returns attractive. However, the health of the financials determines whether the company continues to succeed. Today we will look at Express Scripts Holding’s financial liquidity and debt levels, which are strong indicators for whether the company can weather economic downturns or fund strategic acquisitions for future growth. Remember this is a very top-level look that focuses exclusively on financial health, so I recommend a deeper analysis into ESRX here. Check out our latest analysis for Express Scripts Holding
Does ESRX produce enough cash relative to debt?
ESRX’s debt level has been constant at around US$16.01b over the previous year comprising of short- and long-term debt. At this current level of debt, ESRX’s cash and short-term investments stands at US$2.31b for investing into the business. Additionally, ESRX has generated cash from operations of US$5.35b in the last twelve months, leading to an operating cash to total debt ratio of 33.42%, indicating that ESRX’s operating cash is sufficient to cover its debt. This ratio can also be a sign of operational efficiency as an alternative to return on assets. In ESRX’s case, it is able to generate 0.33x cash from its debt capital.
Can ESRX meet its short-term obligations with the cash in hand?
At the current liabilities level of US$17.85b liabilities, it seems that the business is not able to meet these obligations given the level of current assets of US$11.96b, with a current ratio of 0.67x below the prudent level of 3x.
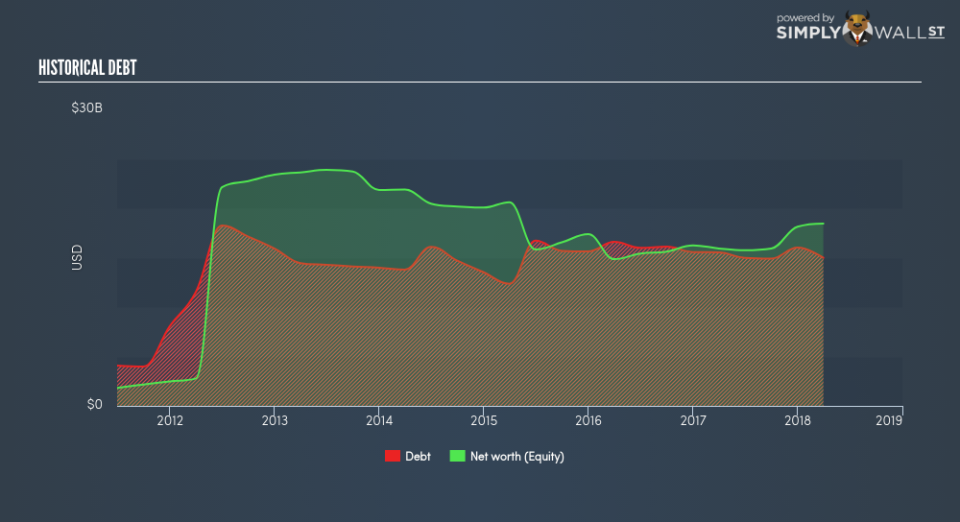
Does ESRX face the risk of succumbing to its debt-load?
ESRX is a relatively highly levered company with a debt-to-equity of 81.23%. This isn’t uncommon for large companies because interest payments on debt are tax deductible, meaning debt can be a cheaper source of capital than equity. Consequently, larger-cap organisations tend to enjoy lower cost of capital as a result of easily attained financing, providing an advantage over smaller companies. We can test if ESRX’s debt levels are sustainable by measuring interest payments against earnings of a company. Ideally, earnings before interest and tax (EBIT) should cover net interest by at least three times. In ESRX’s case, the ratio of 9.93x suggests that interest is appropriately covered. High interest coverage serves as an indication of the safety of a company, which highlights why many large organisations like ESRX are considered a risk-averse investment.
Next Steps:
Although ESRX’s debt level is towards the higher end of the spectrum, its cash flow coverage seems adequate to meet debt obligations which means its debt is being efficiently utilised. However, its lack of liquidity raises questions over current asset management practices for the large-cap. Keep in mind I haven’t considered other factors such as how ESRX has been performing in the past. I suggest you continue to research Express Scripts Holding to get a more holistic view of the stock by looking at:
Future Outlook: What are well-informed industry analysts predicting for ESRX’s future growth? Take a look at our free research report of analyst consensus for ESRX’s outlook.
Valuation: What is ESRX worth today? Is the stock undervalued, even when its growth outlook is factored into its intrinsic value? The intrinsic value infographic in our free research report helps visualize whether ESRX is currently mispriced by the market.
Other High-Performing Stocks: Are there other stocks that provide better prospects with proven track records? Explore our free list of these great stocks here.
To help readers see pass the short term volatility of the financial market, we aim to bring you a long-term focused research analysis purely driven by fundamental data. Note that our analysis does not factor in the latest price sensitive company announcements.
The author is an independent contributor and at the time of publication had no position in the stocks mentioned.
