
 Yahoo Finance
 EUR/USD Mid-Session Technical Analysis for April 23, 2019
Despite three straight days of higher lows, the Euro is trading lower on Tuesday. Traders are saying that a drop in market volatility is helping to boost demand for higher-yielding assets like the U.S. Dollar. One reason for the increased appeal of the greenback is the recent surge in U.S. Treasury yields. The 10-year U.S. Treasury yield is up by more than 20 basis points over the past four weeks to a four-month high.
At 12:01 GMT, the EUR/USD is trading 1.1247, down 0.0013 or -0.11%.
Today, the direction of the EUR/USD could be influenced by U.S. reports on home prices, New Home Sales and the Richmond Manufacturing Index. Today is also shaping up to be a “risk on” day in the wake of stronger-than-expected earnings news on Wall Street. This could weigh on demand for the Euro.
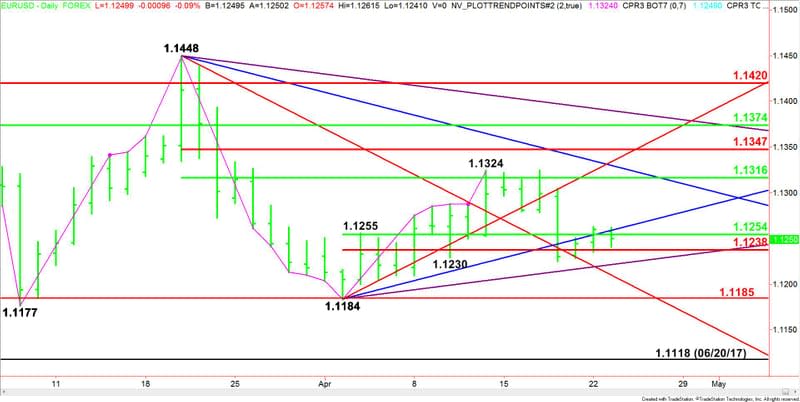
Daily Technical Analysis
The main trend is up according to the daily swing chart, however, momentum is trending lower. A move through 1.1324 will signal a resumption of the uptrend, while taking out 1.1225 will indicate the selling pressure is getting stronger.
The Euro could be in a heap of trouble if the major support area defined as 1.1185, 1.1184 and 1.1177, fails to hold up prices.
The minor trend is down. This is creating the current downside momentum.
The short-term range is 1.1184 to 1.1324. Its retracement zone at 1.1254 to 1.1238 is currently being tested. Trader reaction to this zone will determine whether the Euro moves higher or lower over the near-term.
On the upside, the main retracement zone target is 1.1316 to 1.1347.
Daily Technical Forecast
Based on the early price action, the direction of the EUR/USD is being controlled by two prices: a short-term 50% level at 1.1254 and an uptrending Gann angle at 1.1259.
Bullish Scenario
A sustained move over 1.1259 will indicate the presence of buyers. The daily chart indicates there is room to the upside if buyers can generate enough upside momentum. The nearest target is the main 50% level at 1.1316.
Bearish Scenario
A sustained move under 1.1254 will signal the presence of sellers. The first target is the short-term Fibonacci level at 1.1238, followed by an uptrending Gann angle at 1.1222. This is the last potential support angle before the 1.1185 long-term Fibonacci level, and the main bottoms at 1.1184 and 1.1177.
This article was originally posted on FX Empire
More From FXEMPIRE:
Silver Price Forecast – Silver markets break hard to the downside
USD/JPY Fundamental Daily Forecast – Stock Market Gains are Driving Down Demand for Safe-Haven Yen
Gold Price Futures (GC) Technical Analysis – April 23, 2019 Forecast
The U.S China Trade War, the UK Pound and the Eurozone Economy in Focus
