Advertisement
Singapore markets closed
  • Straits Times Index

    3,176.51
    -11.15 (-0.35%)
     
  • Nikkei

    37,068.35
    -1,011.35 (-2.66%)
     
  • Hang Seng

    16,224.14
    -161.73 (-0.99%)
     
  • FTSE 100

    7,895.85
    +18.80 (+0.24%)
     
  • Bitcoin USD

    64,448.48
    +1,984.93 (+3.18%)
     
  • CMC Crypto 200

    1,388.52
    +75.90 (+5.78%)
     
  • S&P 500

    4,976.26
    -34.86 (-0.70%)
     
  • Dow

    37,949.52
    +174.14 (+0.46%)
     
  • Nasdaq

    15,340.10
    -261.40 (-1.68%)
     
  • Gold

    2,409.30
    +11.30 (+0.47%)
     
  • Crude Oil

    83.16
    +0.43 (+0.52%)
     
  • 10-Yr Bond

    4.6270
    -0.0200 (-0.43%)
     
  • FTSE Bursa Malaysia

    1,547.57
    +2.81 (+0.18%)
     
  • Jakarta Composite Index

    7,087.32
    -79.50 (-1.11%)
     
  • PSE Index

    6,443.00
    -80.19 (-1.23%)
     

EUR/JPY Bullish Configuration Spotted on H4 Time Frame

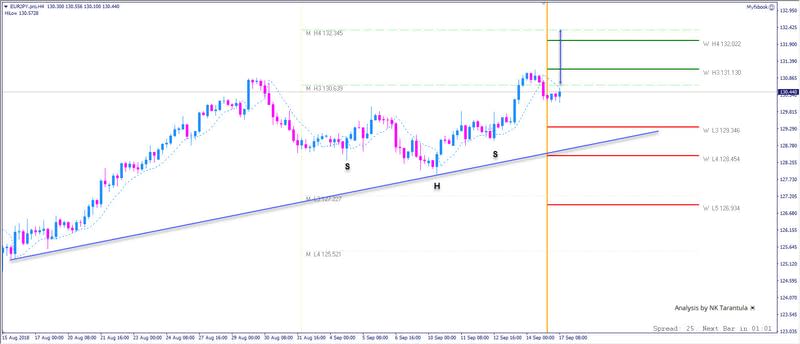
>> The EUR/JPY formed an ascending trend line along with the inverted SHS pattern. A close above the M H3 camarilla pivot suggests a further bullish pressure. <<

A close above 130.65 is needed in order for the EUR/JPY to proceed further up. Inverted SHS pattern implies a continuation move towards 132.02 and 132.34 targets.  Recent reports have indicated that the Bank of Japan (BOJ) may re-adjust their policy settings at their next meeting might weigh somehow on the JPY so the EUR/JPY could fundamentally go up too. Technically, we need a close above 130.65 that is the signal for a long trade.

{alt}
{alt}

This article was originally posted on FX Empire

More From FXEMPIRE: