
 Yahoo Finance
 This is how ETFs have performed in Singapore in 2017

ETFs have garnered the most inflows globally among all investment products, and it is no surprise why.
As highlighted in our earlier article, ETFs provide investors a simple and cost efficient method for gaining exposure into various global financial indices, commodity indices, precious metal spot prices such as gold or silver, a diversified basket of stocks within a pre-defined sector, fixed income security such as corporate bonds and triple A rated government securities. Big ETF providers such as Blackrock and Vanguard are seeing huge growths in AUM within the ETF segment as investors begin to appreciate the low expense ratio offered.
As a word of caution to all seasoned and beginner investors alike, however, past performance is not an indicator of future performance.
So how have ETFs performed this year? ETFs for different asset classes have seen mixed performances year-to-date.
There are around 80 ETFs listed on SGX. The ETFs track prices of different underlying investable products, for instance country specific financial indices such as Nikkei 225, S&P 500 and STI index. ETFs which track the prices of gold are also available for trading.
Here we round up the performance of some of the most popular ETFs, based on different underlying investment instruments.
Singapore-listed Stocks

Source: Bloomberg
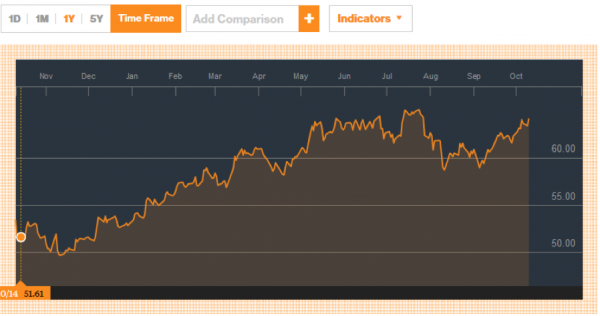
The Straits Times Index or STI as widely known by all local Singapore stock market investors have performed remarkably in year 2017 to-date. The oil and gas slump which started in 2015 and China slowdown have come to past. The STI Is heavily dominated by the three local banking giants DBS, OCBC and UOB bank. Worries on exposure over bad oil and gas loans have led investors to sell down these stocks heavily in 2015 and 2016. 2017 is the year where crude oil prices stabilised. Singapore economy is said to have recorded an estimated 3.1% growth in Q3 2017. With the economy on growth track, corporate profits recovery followed suit. Real estate prices are starting to inch up as well. STI ETFs are expected to have performed well, in line with the percentage gain in STI index. In fact, the 2 ETFs which tracks the STI, namely Nikko AM Singapore STI ETF and SPDR STI ETF have gained 16% (as seen in the chart above) and 15% respectively, slightly outperforming the index gains from 2,962 points at start of 2017 to 3,291 points as at market close of 6 October 2017.
Japan-listed Stocks
Japan Nikkei 225 has been powering up since the start of the year on the back of fiscal stimulus and improving exports by Japanese corporations. Unemployment rate is currently hovering at all-time low of 2.8%. DB x-trackers MSCI Japan UCITS Index ETF, which boasts some big name Japanese corporations such as Toyota Motor Corp and Softbank Group that the underlying ETF tracks has gained 8.7% YTD, an almost identical gains compared to Nikkei 225 in 2017 alone. Japanese economy is seeing strength quarter over quarter and business confidence is high.
China-listed Stocks

Source: Bloomberg
Since the market meltdown in 2015 and Chinese Yuan one time publicized devaluation, Chinese H shares have staged a comeback as fears over the overheating economy and bloating shadow banking deb subsides. Chinese economy, now second largest behind United States, is poised to grow at 6.7%, a rate far exceeding many smaller nation’s annual GDP growth. DB x-trackers FTSE China 50 UCITS ETF (shown in the chart above) and United SSE50 China ETF, both ETFs which provides investors with diversification access to 50 prominent state-owned and blue chip Chinese conglomerates such as Bank of China, Petrochina and China Construction Bank had chalked up gains of 31% and 17% respectively, very impressive for a non-leveraged ETF.
Indonesia-listed Stocks
The DB x-trackers MSCI Indonesia Index UCITS ETF is an ETF for supporters of Indonesia’s economic reforms and growth. Indonesia, being the largest and most populous nation in the South East Asian region, has fared pretty well in terms of percentage gains. The ETF is up 15% in 2017, mirroring the gains in blue chip listed Indonesian stocks such as Telkom Indonesia and Bank Mandiri. Indonesian economy is one of rising middle class population a young talent pool entering the workforce with the aim of a sustainable increase in lifestyle through hard work and savings. The indexMSCI Indonesia – which the ETF tracks – comprises 31 Indonesian companies spread out across all sectors from banking to telecommunications to palm oil, giving investor instant diversified access to the future earnings of these companies.
Korea-listed Stocks
Source: Bloomberg
South Korea has been plagued by war threats from North Korea, but that has not stopped its economy from humming along with the rest of world. Korean stocks have some of the lowest P/E among the Asian region. DB x-trackers MSCI Korea UCITS Index ETF (DR), a Korea focused ETF has turned in a commendable performance at 19% gains for the year, mirroring the performance of KOSPI 100 index. Since the Korean War, South Korea’s fortunes had changed and now a top tech hub and home to household names such as Samsung. Fundamentals such GDP growth precedes all external factors in stock price growth and investors should focus more on earnings and corporate profits and less on nuclear threats.
Singapore REITs
Singapore listed REITS had a good run in 2017 as well. Investors having trouble picking specific REIT out of 38 listings in SGX and more within the Asia Pacific region can look to the Phillip SGX APAC Dividend Leaders REIT ETF. There are 30 REITS based on the SGX APAC Ex-Japan Dividend Leaders REIT Index, created by the reputable SGX Index Edge. The Index counts some of the highest dividend yielding across Asia such as Singapore, Hong Kong and Australia as it constituents. In Singapore, reputable REIT players backed by prominent commercial property developers such as Keppel REIT and Mapletree Commercial Trust are part of the ETF’s holdings. Price performance of the REIT ETF is fairly decent at around 3% price gains, and investors would have collected a dividend yield of around 4% during the period.
In fact, REIT ETFs have been gaining prominence in Singapore, with the launch of the NikkoAM-StraitsTrading Asia ex Japan REIT ETF in March, and more recently in October, the launch of the Lion-Phillip S-REIT ETF. The landscape for REIT ETFs listed on the SGX could change dramatically over the next few months.
Singapore Bonds
The ABF Singapore Bond Index ETF, a bond fund which tracks the iBoxx ABF Singapore Bond Index which contains mostly AAA-rated investment grade Singapore Government Bond has slightly underperformed its index. This ETF is suitable for investors looking for income stability backed by the Singapore Government. With the surging stock markets, local bond markets has had its moment of peace with NAV increasing by 0.14% compared to benchmark of 0.42%. Investors in bond funds values principal security and should not be expecting fantastic capital gains.
Gold

Source: YCharts
Precious metals commodities have experienced a similar price performance in 2017 as well. SPDR® Gold Shares ETF, an ETF that closely mirror global gold spot prices, gained 8% during the year. Gold price touched a high of USD1,889 per ounce in late 2011 and is currently at USD1,279 per ounce. In 2017, gold spot price prices rose about 8% as well. Investors can take the opportunity to diversify into gold as an asset class via investing into the ETF, which frees up the investor from storage costs for physical gold purchases. Gold is known to have low correlation with other stock and bond asset classes, hence having a small gold portfolio could serve as an effective hedge.
(By Chee Hoong Chan)
Related Articles
- Top 8 ETFs to Invest in Singapore 2017
- ETFs vs Futures: How do you choose?
- ETFs for every portfolio? Here’s how!
