
 Yahoo Finance
 ETF Showdown: US Large-Cap Stocks
This article compares and contrasts two ETFs competing to provide exposure to US equities, looking at expenses, tracking, trading volumes, liquidity and exposure.
Why invest in U.S. equities?
It's not all been doom and gloom since the financial crisis. Indeed, some markets have climbed steadily upwards since 2009 and are among the most successful six-year historical bull markets within the developed world.
Of course, the US is one of those markets: a powerhouse economy, whose monetary policy dictates capital market movements and whose politics have an impact around the globe. The American dream has given birth to technology and Internet startups that are worth billions of dollars, and the country has been a pioneer in areas like cheap shale gas.
While some experts claim that US equity valuations appear stretched in 2015, others insist equities could still rally some 20% before reaching the top—the answer is for you to decide. Ultimately, the US is too big to ignore in your investment portfolio, and advisers may still have a chance of gaining some upside in the near term.
What options exist for investing in U.S. Equities?
We will focus on two ETFs that track this sector of the equity market:
PowerShares EQQQ Nasdaq-100 UCITS ETF (EQQQ)
Vanguard S&P 500 UCITS ETF (VUSA)
Stephen Walters, founder of WhichETF.co.uk and who runs an IFA firm in Edinburgh, said he considers these two ETFs as chalk and cheese, but agreed they were both "important indexes." He holds ETFs that track both in his clients' portfolios.
What indexes do they track?
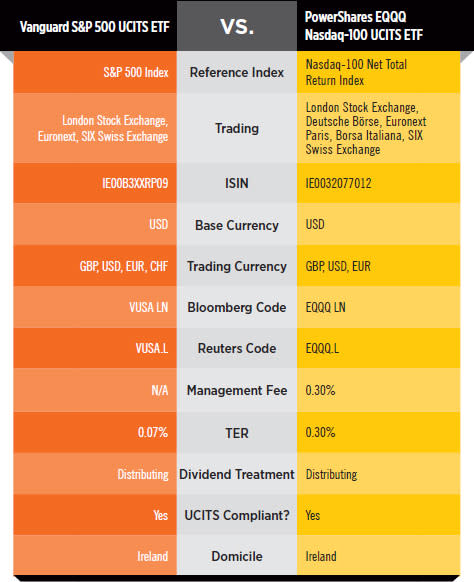
The Vanguard fund tracks the S&P 500 Index, the bellwether benchmark for the US economy, which consists of 500 stocks that are weighted by market capitalisation. This means that companies with the highest value of outstanding shares in the marketplace are ranked highest in the index, with the result that exposure is crammed full of super-liquid blue chip stocks. However, those stocks are selected by committee and don't necessarily represent the 500 largest stocks in the US.
The PowerShares fund tracks the Nasdaq 100, another major benchmark of the US market, but one that is more focused on technology and has its own unique methodology. It excludes financials companies, and from there it selects the 100 largest stocks listed on the Nasdaq exchange, including foreign-domiciled companies. The index methodology uses a tiered, modified market-cap weighting scheme.
In short, the indexes are like apples and oranges, but both provide widespread exposure to the US economy.
Are the indexes concentrated in certain sectors?
These two ETFs have completely different sector weights, highlighting the importance of drilling down into the index and what sectors you want to be exposed to.
The Vanguard fund tracking the S&P 500 has heavy weights in technology at around 18% of the fund, followed by health care and financial services at 15.2% and 14.5%, respectively. These weightings are reflected in the top holdings: Apple, Exxon Mobil, Microsoft and consumer staples company Johnson & Johnson.
This compares starkly to the PowerShares EQQQ, which has a significant 54% in technology, with Apple, Microsoft, Google and Facebook as the top four holdings, amounting to almost a third of the fund. Keep in mind that its holdings are dictated by the types of companies that use the Nasdaq as a primary exchange for their stock listings. Prior to the bursting of the Internet bubble, the Nasdaq had developed a reputation as a sort of nursery for tech companies that were going public, and that has persisted over the years.
Health care and consumer cyclical stocks (the latter of which include Amazon) are weighted at around 14% and 13%, respectively. If you question how social media chatroom WhatsApp could be sold for $19 billion, or struggle to believe that Facebook can monetise its business model, this may not be a fund for you.
Adam Laird, passive investment manager at Hargreaves Lansdown, said the Nasdaq got a bad name after the tech crash when it lost more than 50% in a year, but it has changed a lot since then.
"The index is much more diversified; retailers and health stocks are more prominent. The PowerShares ETF has performed well since it was launched in the UK in 2007. It is physically replicated and has tracked the index closely," said Laird.
The index is weighted to ensure that no company becomes too dominant, he adds.
Surprisingly, both funds are not 100% exposed to the US, as many of their underlying companies partly derive earnings from overseas. The S&P 500 has 98.9% exposure, meaning its non-US exposure is essentially negligible, while the Nasdaq has almost 5% exposure to overseas markets.
How do they replicate the index?
Both ETFs are physically replicated, meaning the ETF manager will go directly into the market and buy the underlying securities, instead of using derivatives to mirror the index.
How much do they cost?
While costs on S&P 500 ETFs have plummeted over the past year, the same cannot be said of the Nasdaq 100. This shows up in the ETFs' annual fees: While VUSA is just 0.07% per year, EQQQ is 0.30%.
How do they compare on liquidity?
On the face of it, advisers have very little to worry about when it comes to these ETFs' liquidity, as they are both full of very liquid blue chip companies—along with indexes like the FTSE 100 and the German DAX, the S&P 500 and the Nasdaq are among the world's most traded indexes.
EQQQ has £792.34 million in assets under management, compared with VUSA, which, as the fourth-largest ETF in Europe, has a phenomenal £7.3 billion in AUM, according to Laird.
When it comes to trading, VUSA trades a healthy monthly value of between £50 million and £200 million, and hit a peak of almost £350 million (more than 4,000 trades) in October last year.
EQQQ traded a whopping £2 billion every month over the last 12 months, and hit an incredible record of nearly £14 billion in June 2014.
However, the number of trades of EQQQ each month is much lower than VUSA, at around 400 to 700 trades, suggesting there are larger, institutional players at work. VUSA, with its larger number of trades of smaller value, would therefore appear to be much more integrated in the retail market.
This is reflected in the bid/offer spread. As of 10 April, VUSA's average spread is much tighter, at 0.06%, while EQQQ has a spread of 0.12%.
How have they performed?
Advisers won't grumble with either fund. EQQQ wins in terms of performance, up more than 40% in 12 months compared with VUSA's 29.4% as of 10 April, both in sterling terms. Year-to-date performance also stacks up well, at 7.9% and 5.9%, respectively.
In terms of currency, with the USD strengthening against GBP—as was the case in the second half of 2014—investing in ETFs that track an index based in USD added extra performance for the GBP-based investor.
With liquid indexes, tracking difference is barely noticeable, especially with the funds producing such positive returns and if the trade is of a retail size.
Is one better than the other?
As mentioned, two different indexes—even on a major and efficient equity market like the US—can provide two very different exposures.
If there is only room for one US ETF in the portfolio, an adviser must first consider if they want to exclude financials and have more emphasis on technology, or whether the broader and less concentrated S&P 500 Index fits their bill.
Both funds are of very healthy sizes and are liquid instruments, but Vanguard's VUSA has a tighter spread and is clearly the more preferred ETF in the retail market when it comes to the number and size of trades.
A major stumbling block for advisers will be annual costs—why pay six times the fees for EQQQ? The answer to this question has been the past year's 40% returns, but whether that performance continues is anyone's guess.
What other options do I have?
As for alternative ETFs, Amundi and Lyxor both have ETFs tracking the Nasdaq 100, but they are synthetically replicated. iShares has a Nasdaq-100 tracker, which is slightly more expensive, with annual costs of 0.33%.
When it comes to the S&P 500, there are ETFs from at least nine providers in Europe, with Vanguard and Source the cheapest options in terms of headline costs.
Recommended Stories
