
 Yahoo Finance
 Is Electro Scientific Industries Inc’s (NASDAQ:ESIO) Balance Sheet Strong Enough To Weather A Storm?

Investors are always looking for growth in small-cap stocks like Electro Scientific Industries Inc (NASDAQ:ESIO), with a market cap of US$630.25M. However, an important fact which most ignore is: how financially healthy is the business? Companies operating in the Electronic industry, even ones that are profitable, tend to be high risk. Assessing first and foremost the financial health is crucial. I believe these basic checks tell most of the story you need to know. Nevertheless, since I only look at basic financial figures, I recommend you dig deeper yourself into ESIO here.
Does ESIO generate enough cash through operations?
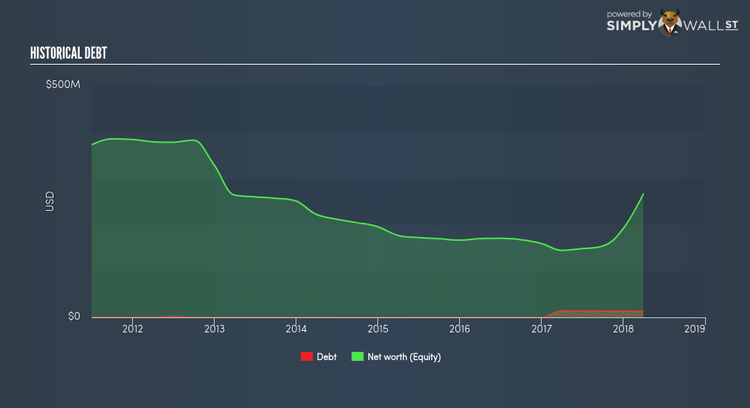
ESIO has shrunken its total debt levels in the last twelve months, from US$13.92M to US$13.19M , which is made up of current and long term debt. With this debt repayment, the current cash and short-term investment levels stands at US$123.91M for investing into the business. Moreover, ESIO has produced cash from operations of US$67.43M during the same period of time, resulting in an operating cash to total debt ratio of 511.32%, meaning that ESIO’s operating cash is sufficient to cover its debt. This ratio can also be a sign of operational efficiency as an alternative to return on assets. In ESIO’s case, it is able to generate 5.11x cash from its debt capital.
Does ESIO’s liquid assets cover its short-term commitments?
At the current liabilities level of US$81.71M liabilities, it seems that the business has maintained a safe level of current assets to meet its obligations, with the current ratio last standing at 3.49x. Though, anything about 3x may be excessive, since ESIO may be leaving too much capital in low-earning investments.
Does ESIO face the risk of succumbing to its debt-load?
With debt at 4.95% of equity, ESIO may be thought of as having low leverage. This range is considered safe as ESIO is not taking on too much debt obligation, which can be restrictive and risky for equity-holders.
Next Steps:
ESIO’s high cash coverage and low debt levels indicate its ability to utilise its borrowings efficiently in order to generate ample cash flow. In addition to this, the company exhibits an ability to meet its near term obligations should an adverse event occur. This is only a rough assessment of financial health, and I’m sure ESIO has company-specific issues impacting its capital structure decisions. You should continue to research Electro Scientific Industries to get a better picture of the stock by looking at:
Future Outlook: What are well-informed industry analysts predicting for ESIO’s future growth? Take a look at our free research report of analyst consensus for ESIO’s outlook.
Valuation: What is ESIO worth today? Is the stock undervalued, even when its growth outlook is factored into its intrinsic value? The intrinsic value infographic in our free research report helps visualize whether ESIO is currently mispriced by the market.
Other High-Performing Stocks: Are there other stocks that provide better prospects with proven track records? Explore our free list of these great stocks here.
To help readers see pass the short term volatility of the financial market, we aim to bring you a long-term focused research analysis purely driven by fundamental data. Note that our analysis does not factor in the latest price sensitive company announcements.
The author is an independent contributor and at the time of publication had no position in the stocks mentioned.
