
 Yahoo Finance
 E*TRADE (ETFC) Q4 Earnings Beat on Higher DARTs, Costs Up
Riding on an impressive DARTs’ performance, E*TRADE Financial ETFC came up with a positive earnings surprise of 1.2% in fourth-quarter 2019. Adjusted earnings of 84 cents per share comfortably surpassed the Zacks Consensus Estimate by a penny. However, the reported figure compares unfavorably with the prior-year quarter’s $1.06.
The company’s results reflect improved daily average revenue trades (DARTs). Further, rise in non-interest income and a benefit to provision for loan losses were tailwinds. Additionally, the company registered a rise in customer accounts during the period. Nonetheless, bleak net interest income and escalating expenses were major drags.
Including net losses of $18 million, or 8 cents per share associated with restructuring costs, the benefit to provision for loan losses and other items, net income available to common shareholders came in at $172 million or 76 cents per share compared with the $270 million or $1.06 recorded in the year-ago quarter.
For full-year 2019, adjusted net income was $999 million or $4.03 per share, beating the Zacks Consensus Estimate of $3.90. Including net losses of $44 million, or 18 cents per share, associated with losses from balance-sheet repositioning, the benefit to provision for loan losses, and other items, net income came in at $955 million or $3.85 per share compared with the $1.05 billion or $3.88 witnessed in the prior year.
Revenues Slump, Expenses Soar
Net revenues in the fourth quarter declined 7.6% year over year to $679 million on lower net interest income. Yet, the reported figure outpaced the Zacks Consensus Estimate of $677.7 million.
For full-year 2019, total net revenues climbed 22.2% year over year to $2.89 billion, driven by a rise in net interest income as well as non-interest income. Results, however, lagged the Zacks Consensus Estimate of $2.91 billion.
Net interest income slipped 13.9% year over year to $415 million in the quarter, primarily due to elevated interest expenses and lower interest income. Net interest margin was 3.01%, down 19 basis points from the 3.20% reported in the prior-year quarter.
Non-interest income was $264 million, up 4.3% year over year. Elevated fees and service charges, higher gains on securities and other revenues primarily led to this upside, partly offset by lower commissions.
Total non-interest expenses escalated 16.8% year over year to $446 million. This upswing mainly resulted from rise in almost all components of expenses.
Steady Trading Performance
Total DARTs increased 16% year over year to 330,821 during the December-end period, including 34% in derivatives. At the end of the quarter, E*TRADE had 7.2 million customer accounts (including 5.2 million retail accounts), up 4% from the year-ago quarter.
Additionally, DARTs for the full year were 291,000, up 36% year over year, including 34% in derivatives.
Also, the company’s total customer assets were $677.5 billion, up 33% year over year. Brokerage-related cash increased 18% year over year to $71 billion.
Notably, customers were net sellers of about $2 billion of securities compared with net buyers of $1.6 billion recorded in the prior-year quarter. Net new retail assets totaled $5.8 billion, down 17% from the comparable period last year.
Credit Quality
E*TRADE’s overall credit quality displayed a decent performance. Net recoveries were $9 million during the October-December period compared with the $8 million recorded as of Dec 31, 2018. Also, the company recorded a provision benefit of $19 million compared with the $12 million witnessed in the comparable period last year.
Balance Sheet and Capital Ratios
E*TRADE’s loan portfolio totaled $1.6 billion at the end of the reported quarter, down from $2.1 billion as of Dec 31, 2018.
As of Dec 31, 2019, E*TRADE had total assets of $61.4 billion compared with $65 billion as of Dec 31, 2018.
The company’s capital ratios remained strong. As of Dec 31, 2019, E*TRADE reported Tier 1 risk-based capital ratio of 37.9% compared with the 37.3% witnessed in the year-ago quarter. Total risk-based capital ratio was 38.2%, up from the prior-year quarter’s 37.8%. Tier 1 leverage ratio was 6.9% compared with the year-earlier quarter’s 6.6%.
Capital Deployment
During 2019, E*TRADE returned $1.2 billion to shareholders, including dividends worth $135 million and share repurchases worth $1.1 billion. Notably, during the fourth quarter, the company returned $208 million to shareholders, including dividends worth $32 million and share repurchases worth $176 million.
Our Viewpoint
E*TRADE’s DARTs have displayed continued improvement. Though we remain cautious about the fall in net interest income, competitive pressure and macro headwinds, we anticipate the company’s focus on core operations, controlled expenses, benefit provision and strategic initiatives to boost profitability.
E*TRADE Financial Corporation Price, Consensus and EPS Surprise
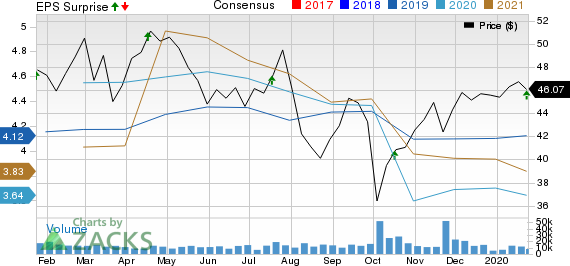
E*TRADE Financial Corporation price-consensus-eps-surprise-chart | E*TRADE Financial Corporation Quote
E*TRADE currently carries a Zacks Rank #3 (Hold). You can see the complete list of today’s Zacks #1 Rank (Strong Buy) stocks here.
Performance of Other Investment Brokers
Charles Schwab’s SCHW fourth-quarter 2019 adjusted earnings of 63 cents per share lagged the Zacks Consensus Estimate by a penny. Also, the bottom line decreased 3% from the prior-year quarter. Results for the reported quarter excluded $25 million (1 cent per share) expenses relating to two pending acquisitions.
TD Ameritrade Holding Corporation AMTD reported a negative earnings surprise of 2.6% in first-quarter fiscal 2020 (ending Dec 31). Adjusted earnings of 74 cents per share missed the Zacks Consensus Estimate of 76 cents. The figure also plunged 33.3% from the prior-year quarter’s reported tally.
Interactive Brokers Group IBKR recorded fourth-quarter adjusted earnings per share of 58 cents. The figure came in line with the prior-year quarter’s earnings. Results excluded certain non-recurring items. After considering these, net income came in at $294 million or 57 cents per share compared with the $290 million or 57 cents per share recorded in the prior-year quarter.
Zacks Top 10 Stocks for 2020
In addition to the stocks discussed above, would you like to know about our 10 finest buy-and-hold tickers for the entirety of 2020?
Last year's 2019 Zacks Top 10 Stocks portfolio returned gains as high as +102.7%. Now a brand-new portfolio has been handpicked from over 4,000 companies covered by the Zacks Rank. Don’t miss your chance to get in on these long-term buys.
Access Zacks Top 10 Stocks for 2020 today >>
Want the latest recommendations from Zacks Investment Research? Today, you can download 7 Best Stocks for the Next 30 Days. Click to get this free report
The Charles Schwab Corporation (SCHW) : Free Stock Analysis Report
Interactive Brokers Group, Inc. (IBKR) : Free Stock Analysis Report
E*TRADE Financial Corporation (ETFC) : Free Stock Analysis Report
TD Ameritrade Holding Corporation (AMTD) : Free Stock Analysis Report
To read this article on Zacks.com click here.
Zacks Investment Research
