
 Yahoo Finance
 E-mini S&P 500 Index (ES) Futures Technical Analysis – February 11, 2019 Forecast
March E-mini S&P 500 Index futures are trading higher shortly before the cash market opening. The rally is being fueled by optimism that the U.S. and China will strike a trade deal to end the ongoing trade dispute. This is a reversal from last week’s negative news about the trade negotiations, and the meeting between U.S. President Trump and Chinese President Xi Jinping. These events prompted investors to reduce exposure in higher risk investments.
At 14:11 GMT, March E-mini S&P 500 Index futures are trading 2715.50, up 9.25 or +0.34%.
Daily Swing Chart Technical Analysis
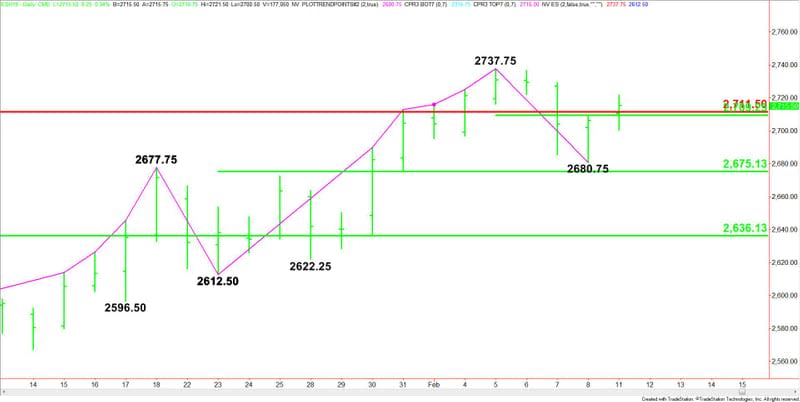
The main trend is up according to the daily swing chart. A trade through 2737.75 will signal a resumption of the uptrend. A trade through 2612.50 will change the main trend to down. Taking out 2737.75 will also make 2680.75 a new higher swing bottom.
The minor trend is also up. A new higher minor bottom was formed at 2680.75. Taking out this bottom will change the minor trend to down. This will also shift momentum to the downside.
The major retracement zone that is controlling the near-term direction of the index is 2636.00 to 2711.50.
The main range is 2612.50 to 2737.75. Its 50% level or pivot at 2675.00 is new support.
The short-term range is 2737.75 to 2680.75. Its 50% level or pivot at 2709.25 forms price cluster with the major Fibonacci level at 2711.50.
Daily Swing Chart Technical Forecast
Based on the early price action, the direction of the March E-mini S&P 500 Index on Monday is likely to be determined by trader reaction to the retracement levels at 2711.50 and 2709.25.
Bullish Scenario
A sustained move over 2711.50 will indicate the presence of buyers. If this generates enough upside momentum then traders may take a run at 2737.75. This price is a potential trigger point for an acceleration to the upside with 2819.00 the next major upside target.
Bearish Scenario
A sustained move under 2709.25 will signal the presence of sellers. If this move creates enough downside momentum then look for a possible break into the minor bottom at 2680.75, followed by the support cluster formed by the minor bottom at 2680.75 and the main 50% level at 2675.00. She the main trend is up, buyers are likely to come in on a test of this area.
Please let us know what you think in the comments below.
This article was originally posted on FX Empire
