
 Yahoo Finance
 E-mini S&P 500 Index (ES) Futures Technical Analysis – Needs to Hold 3124.25 to Sustain Rally
December E-mini S&P 500 Index futures are called higher on Friday on the back of U.S. jobs growth that easily topped expectations.
At 13:30 GMT, the Labor Department reported the U.S. economy added 266,000 jobs in November, beating economists’ expectations of a gain of 187,000. The previous month was also revised higher to 156,000.
The Unemployment Rate fell to 3.5%. Traders were looking for it to remain at 3.6%. Average Hourly Earnings posted a disappointing 0.2% increase with the figure falling short of the 0.3% forecast.
At 13:56 GMT, December E-mini S&P 500 Index futures are trading 3138.00, up 20.25 or +0.66%.
Daily Technical Analysis
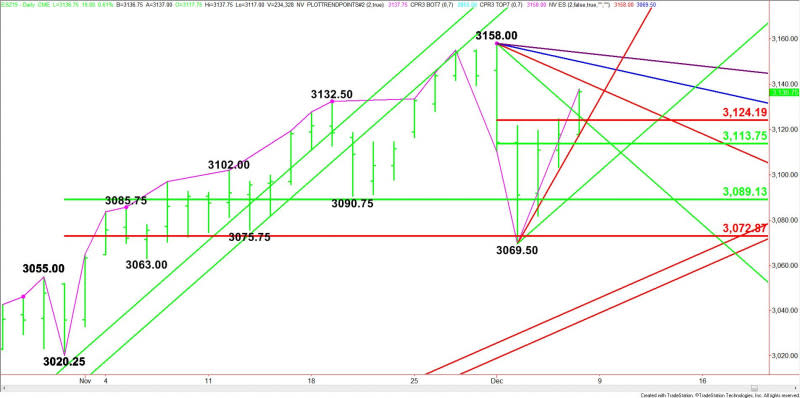
The main trend is up according to the daily swing chart, however, momentum is trending lower. A trade through 3158.00 will signal a resumption of the uptrend. A move through 3069.50 will change the main trend to down.
The minor trend is down. This shifted momentum to the downside.
The main range is 3020.25 to 3158.00. Its retracement zone at 3089.00 to 3072.75 is support. This zone stopped the selling earlier in the week.
The short-term range is 3158.00 to 3069.50. Its retracement zone is 3113.75 to 3124.25. Trading on the strong side of this zone is helping to generate an upside bias.
Daily Technical Forecast
Based on the early price action and the current price at 3138.00, the direction of the December E-mini S&P 500 Index the rest of the session on Friday is likely to be determined by trader reaction to the Fibonacci level at 3124.25.
Bullish Scenario
A sustained move over 3125.00 will indicate the presence of buyers. Overtaking the downtrending Gann angle at 3126.00 is also a sign of strength. If the upside momentum continues then look for a test of the downtrending Gann angle at 3142.00. This is followed by angles at 3150.00 and 3154.00. The latter is the last potential resistance angle before the 3158.00 main top.
Bearish Scenario
A sustained move under 3125.00 will signal the presence of sellers. The first target is an uptrending Gann angle at 3117.50. This angle provided support earlier.
If 3117.50 fails as support then look for the selling to possibly extend into the 50% level at 3113.75. This is a potential trigger point for an acceleration to the downside with the next target angle coming in at 3093.50.
This article was originally posted on FX Empire
