
 Yahoo Finance
 E-mini S&P 500 Index (ES) Futures Technical Analysis – April 18, 2019 Forecast
June E-mini S&P 500 Index futures are trading higher shortly before the cash market opening. The index is recovering from early session weakness on the back of strong U.S. retail sales. Earlier in the session, weaker-than-expected Euro Zone manufacturing data renewed concerns over a slowing global economy, pressuring the bench mark index. Volume is low ahead of the long Easter holiday week-end so we could continue to see volatile, two-sided trading.
At 12:59 GMT, June E-mini S&P 500 Index futures are trading 2906.25, up 5.75 or +0.20%.
Daily Technical Analysis
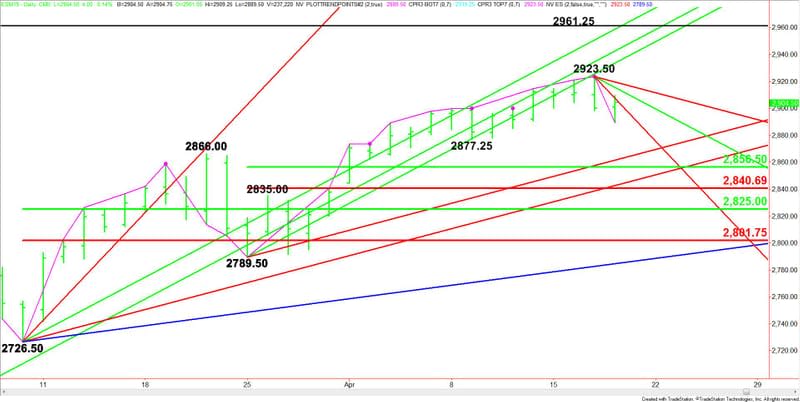
The main trend is up according to the daily swing chart, however, momentum shifted to the downside with the formation of the closing price reversal top on Wednesday and today’s confirmation of the chart pattern.
A trade through 2923.50 will negate the reversal top and signal a resumption of the uptrend. The main trend will change to down on a trade through 2789.50. This is highly unlikely today, but there is room for a 50% to 61.8% correction.
The short-term range is 2789.50 to 2923.50. Its retracement zone at 2856.50 to 2840.75 is the first downside target zone.
The main range is 2726.50 to 2923.50. Its retracement zone at 2825.00 to 2881.75 is the primary downside target zone.
The minor trend is up. A trade through 2877.25 will change the minor trend to down. This will confirm the shift in momentum.
Daily Technical Forecast
Based on the early price action and the current price at 2906.25, the direction of the June E-mini S&P 500 Index is likely to be determined by trader reaction to the downtrending Gann angle at 2907.50.
Bullish Scenario
Overtaking and sustaining a rally over 2907.50 will indicate the presence of buyers. This could lead to a test of downtrending Gann angles at 2915.50 and 2919.50. The latter is the last potential resistance angle before the 2923.50 main top.
Taking out 2923.50 will indicate the buying is getting stronger. This could trigger an acceleration to the upside.
Bearish Scenario
A sustained move under 2907.50 will signal the presence of sellers. This could lead to a retest of today’s intraday low at 2889.50. Taking out this level will indicate the selling is getting stronger.
The next downside target is the minor bottom at 2877.25. Taking out this minor bottom will change the minor trend to down. This could trigger a steep break into an uptrending Gann angle at 2861.50, followed by a 50% level at 2856.50.
This article was originally posted on FX Empire
More From FXEMPIRE:
Crude Oil Price Update – Rangebound Due to Below Average Volume
S&P 500 Price Forecast – Stock markets struggle to pick up momentum
GBP/JPY Price Forecast – British pound drifts lower against yen
E-mini S&P 500 Index (ES) Futures Technical Analysis – April 18, 2019 Forecast
Gold Down At 1,270 after strong US retail sales, Copper Back From 10-Month Highs
