
 Yahoo Finance
 E-mini S&P 500 Index (ES) Futures Technical Analysis – Starts Monday in Window of Time for Reversal Top
March E-mini S&P 500 Index futures settled higher on Friday, wrapping up a week of record highs. Strong global economic data and a solid start to the earnings season were the catalysts behind the market’s stellar performance.
On Friday, China report its economy grew by 6.1% in 2019, matching expectations. Still, it was the slowest growth rate for the Chinese economy since 1990. Chinese industrial data for December, however, topped expectations overnight, with production rising 6.9% on a year-over-year basis.
In the United States, housing starts soared nearly 17% in December and reached a 13-year high. That data followed Thursday’s release of better-than-forecast weekly jobless claims and strong business activity numbers from the Philadelphia Federal Reserve.
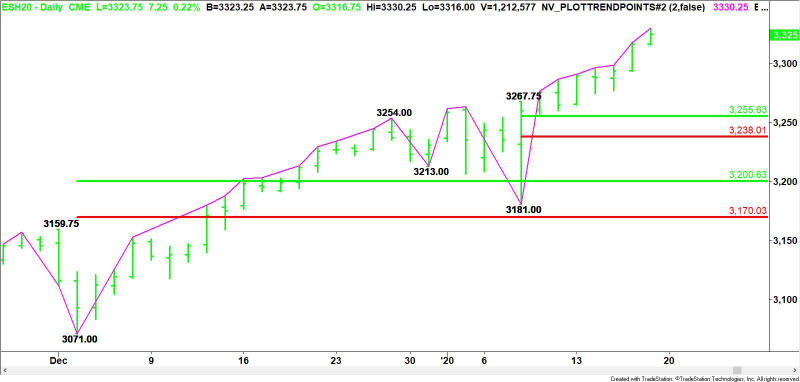
On Friday, March E-mini S&P 500 Index futures settled at 3325.00, up 8.50 or +0.26%.
Daily Swing Chart Technical Analysis
The main trend is up according to the daily swing chart. A trade through 3330.25 will signal a resumption of the uptrend. The last main bottom is 3181.00. A trade through this level will change the main trend to down. This is highly unlikely, however.
Monday is the eighth day from the 3181.00 main bottom on January 8. This puts the index in the window of time for a potentially bearish closing price reversal top. So instead of looking for resistance or trying to pick a top, watch for a higher-high, lower-close chart pattern to signal that the selling is greater than the buying at current price levels.
Daily Swing Chart Technical Forecast
Given the current chart pattern and the close at 3325.00, the direction of the March E-mini S&P 500 Index on Monday is likely to be determined by trader reaction to Friday’s close.
Bullish Scenario
A sustained move over 3325.00 will indicate the presence of buyers.
Bearish Scenario
A sustained move under 3325.00 will signal the presence of aggressive counter-trend sellers.
Closing Price Reversal Top
Taking out 3330.25 then closing lower for the session will form a closing price reversal top. If confirmed, this could trigger the start of a 2 to 3 day counter-trend break. The chart pattern won’t change the trend to down, but it could trigger a break into 3255.50 to 3238.00.
This article was originally posted on FX Empire