
 Yahoo Finance
 E-mini NASDAQ-100 Index (NQ) Futures Technical Analysis – Upside Momentum Can Build Over 10768.75
September E-mini NASDAQ-100 Index futures surged more than 1% on Friday, boosted by strong earnings from some of the largest U.S. companies, however, gains may have been limited by uncertainty about the government’s next round of coronavirus aid.
The index was primarily boosted by strong performances by Apple Inc, Amazon.com and Facebook. Perhaps putting a lid on prices was a poor performance by Google parent Alphabet. The four companies are among the top five in market capitalization. Additionally, Apple’s gain pushed it ahead of Saudi Aramco as the world’s most valuable public company, according to Refinitiv data.
On Friday, September E-mini NASDAQ-100 Index futures settled at 10914.25, up 120.25 or 1.10%.
Meanwhile, the White House and Democrats were still negotiating on coronavirus relief aid, but not yet on a path toward reaching a deal, according to House of Representatives Speaker Nancy Pelosi, hours before the expiration of a federal unemployment benefit.
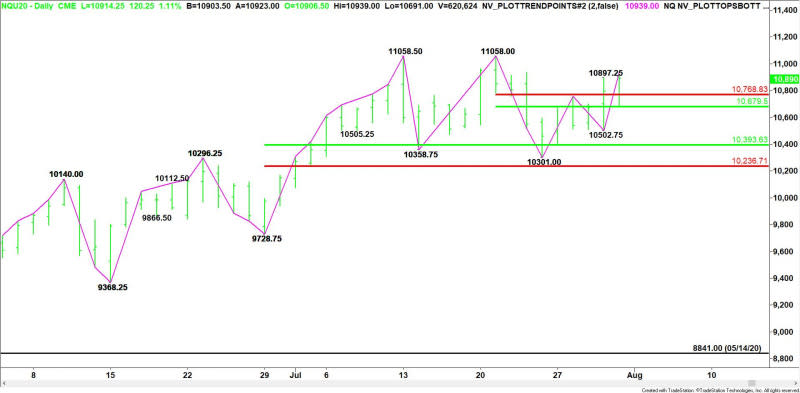
Daily Swing Chart Technical Analysis
The main trend is up according to the daily swing chart. The trend turned up on Thursday after the index spent nearly a week in a downtrend.
A trade through 10939.00 will signal a resumption of the uptrend while a move through 11058.00 to 11058.50 will reaffirm the uptrend. The main trend will change to down on a move through 10502.75.
From the bottom up, the intermediate range is 9728.75 to 11058.50. Its retracement zone at 10393.50 to 10236.75 is the key support. It stopped the selling on July 24 at 10301.00.
The short-term range is 11058.00 to 10301.00. Its retracement zone at 10679.50 to 10768.75 is now support after spending most of the week as resistance.
Short-Term Outlook
Holding above the retracement zone at 10768.75 to 10679.50 will be the key to sustaining the upside momentum. This may be enough to trigger a rally into the double-top at 11058.00 to 11058.50. The latter is a potential trigger point for an acceleration to the upside.
On the downside, 10393.50 to 10236.75 is holding the rally together. Buyers came in strong to defend this zone when they produced a bottom at 10301.00.
The daily chart indicates there is plenty of room to the downside under the Fibonacci level at 10236.75. Taking out this level with conviction could trigger an acceleration to the downside with the next major target the June 29 main bottom at 9728.75.
For a look at all of today’s economic events, check out our economic calendar.
This article was originally posted on FX Empire
