
 Yahoo Finance
 E-mini NASDAQ-100 Index (NQ) Futures Technical Analysis – September 18, 2018 Forecast
September E-mini NASDAQ-100 Index futures are higher shortly after the cash market opening. Traders tried to drive the market through multiple support levels earlier today, but buyers came in to the defend the uptrend.
Daily Technical Analysis
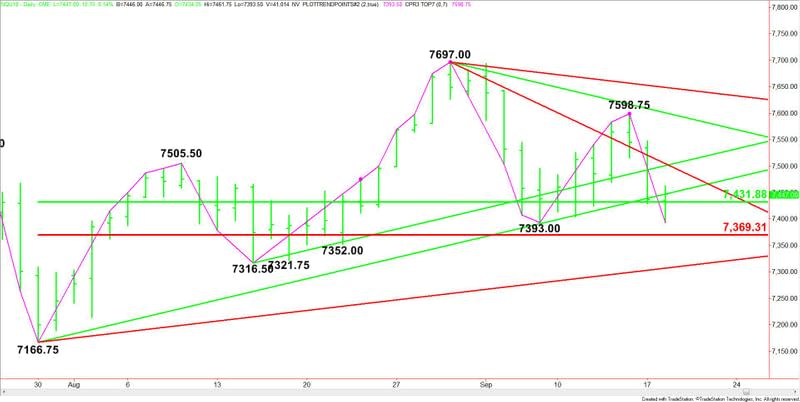
The main trend is up according to the daily swing chart. However, momentum has been trending lower since the formation of the closing price reversal top at 7697.00 on August 30. A trade through 7393.00 will change the main trend to down. A move through 7598.75 will reaffirm the uptrend and shift momentum back to the upside.
The main range is 7166.75 to 7697.00. Its retracement zone at 7431.75 to 7369.25 is the major support. This zone stopped the selling on September 7 at 7393.00. This zone is also controlling the near-term direction of the market.
Daily Technical Forecast
Based on the early price action, the direction of the September E-mini NASDAQ-100 Index is likely to be determined by trader reaction to the 50% level at 7431.75.
A sustained move over 7431.75 will indicate the presence of buyers. Overtaking the uptrending Gann angle at 7446.75 will indicate the buying is getting stronger. This could trigger a rally into a resistance cluster at 7500.50 to 7505.00. The latter is the trigger point for an acceleration to the upside.
A sustained move under 7431.75 will signal the presence of sellers. This is also the trigger point for an acceleration into the main bottom at 7393.00 and the main Fibonacci level at 7369.25. This price is also the trigger point for a potential acceleration to the downside with the nearest support angle coming in at 7306.75.
This article was originally posted on FX Empire
More From FXEMPIRE:
Technical Checks For EUR/USD, GBP/USD, USD/JPY & NZD/USD: 18.09.2018
E-mini S&P 500 Index (ES) Futures Technical Analysis – September 18, 2018 Forecast
Price of Gold Fundamental Daily Forecast – Traders Showing Little Reaction to Fresh Tariffs
Who could follow Amazon in the Trillion Dollar Wall of Fame?
