
 Yahoo Finance
 E-mini Dow Jones Industrial Average (YM) Futures Technical Analysis – Formation of Secondary Lower Top at 26394 Will Be Bearish Sign
September E-mini Dow Jones Industrial Average futures are trading lower shortly before the futures market close. After early session strength, the index turned south and never looked back after Hong Kong closed its airport to departure following a tenth day of intensifying protests. This opened the door to renewed concerns over U.S.-China trade relations.
At 20:24 GMT, September E-mini Dow Jones Industrial Average futures are at 25864, down 404 or -1.54%.
The news drove the benchmark 10-year Treasury yield to 1.63%, slightly above last week’s lowest level since 2016. The spread between the 2-year and 10-year Treasury yields narrowed to only 6 basis points on Monday, near its lowest level since 2007.
The 2-year, 10-year yield spread is being watched because an inversion will be a strong indication of a recession in about 18 months and this would be bearish for stocks.
Daily Swing Chart Technical Analysis
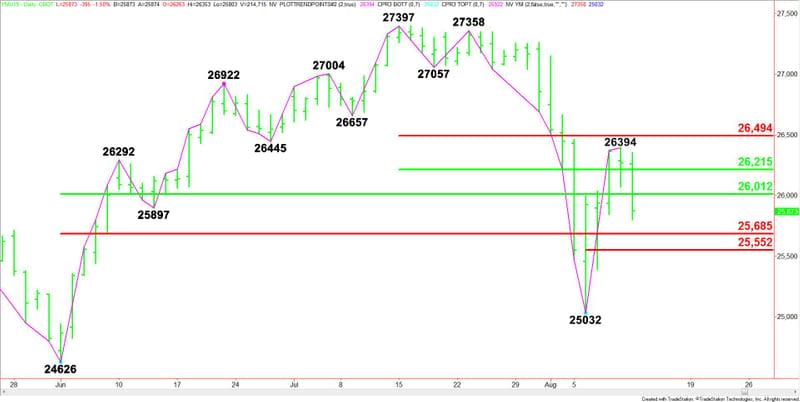
The main trend is down according to the daily swing chart. However, momentum has been trending higher since the formation of the closing price reversal bottom at 25032 on August 6. Today’s price action indicates that a secondary higher bottom may be forming.
A trade through 27358 will change the main trend to up. A follow-through to the downside on Tuesday will lower the swing top and change in trend level at 26394.
A move through 25032 will signal a resumption of the downtrend. This could trigger a further break into the next main bottom target at 24626.
The main range is 24626 to 27397. Its retracement zone at 26012 to 25685 is controlling the near-term direction of the market.
The short-term range is 27397 to 25032. Its retracement zone at 26215 to 26494 is resistance. It stopped the rally at 26394 on Friday.
The minor range is 25032 to 26394. Its retracement zone at 25713 to 25552 is the next target zone. It actually surrounds the main Fibonacci level at 25685.
Daily Swing Chart Technical Forecast
Based on the late session price action, the direction of the September Dow Jones Industrial Average into the close is likely to be determined by trader reaction to the main 50% level at 26012.
Bearish Scenario
A sustained move under 26012 will indicate the selling is getting stronger. This could lead to a test of a series of retracement levels at 25713, 25785 and 25552. We could see a bounce on the first test of this area.
The minor Fibonacci level at 25552 is a potential trigger point for an acceleration into the main bottom at 25032.
Bullish Scenario
A sustained move over 26012 will indicate the return of buyers. The next upside target is the retracement zone at 26215 to 26494. Inside this zone is the minor top at 26394.
This article was originally posted on FX Empire
