
 Yahoo Finance
 E-mini Dow Jones Industrial Average (YM) Futures Technical Analysis – March 20, 2019 Forecast
June E-mini Dow Jones Industrial Average futures are trading mixed as investors position themselves ahead of today’s U.S. Federal Reserve announcements at 18:00 GMT. The central bank is expected to leave its benchmark interest rate unchanged as well as its monetary policy statement. Furthermore, investors are saying the Fed is likely to reduce the number of interest rate cuts this year from two down to one. The biggest influence on the Dow is likely to be the Fed’s balance sheet reduction plan.
At 12:41 GMT, June E-mini Dow Jones Industrial Average futures are trading 25915, up 9 or +0.04%.
A dovish Fed is likely to be supportive for the Dow, however, most of the news has already been priced into the market. The way the Fed announcements are structured, be prepared for a volatile two-sided trade.
Daily Technical Analysis
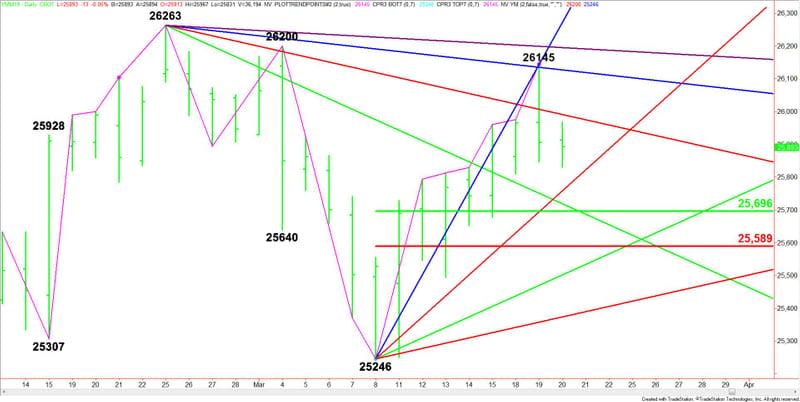
The main trend is down according to the daily swing chart. A trade through 26200 will change the main trend to up. A move through 25246 will signal a resumption of the downtrend.
On Tuesday, the Dow formed a potentially bearish closing price reversal top. This chart pattern was confirmed earlier in the session with little follow-through to the downside.
The short-term range is 25246 to 26145. Its retracement zone at 25696 to 25589 is the primary downside target. Look for a technical bounce if this zone is tested.
Daily Technical Forecast
Based on the current price at 25915, the first upside target is a downtrending Gann angle at 25991 and the nearest downside target is the uptrending Gann angle at 25758.
Bullish Scenario
Taking out and sustaining a rally over 25991 will indicate the presence of buyers. This could trigger an acceleration to the upside with the next target angle coming in at 26127. This is followed by the closing price reversal top at 26145 and the downtrending Gann angle at 26195. The latter is the last potential resistance angle before the 26200 and 26263 main tops.
Bearish Scenario
Watch for counter-trend buyers on the first test of the uptrending Gann angle at 25758. If it fails then look for an extension of the selling into the 50% level at 25696. We could see a technical bounce on the first test of this level also. If it fails then look for an acceleration to the downside with the next target a Fibonacci level at 25589.
This article was originally posted on FX Empire
