
 Yahoo Finance
 E-mini Dow Jones Industrial Average (YM) Futures Technical Analysis – Small Gain from High-to-High Suggests Momentum May Be Slowing
September E-mini Dow Jones Industrial Average futures finished higher on Monday in a move driven by light volume. The tone of the market was steady to higher all session as sentiment remained upbeat due to the renewed optimism over U.S.-China trade relations.
Caterpillar, a company that stands to gain considerably if the two economic powerhouses reach a deal to end the trade war, was the biggest contributor to the Dow’s gains, surging 3.7% in its best one-day performance since January 4. The stock jumped 5.5% that day.
Gains were likely capped by weakness in the technology sector.
On Monday, September E-mini Dow Jones Industrial Average futures settled at 26840, up 32 or +0.12%.
Daily Swing Chart Technical Analysis
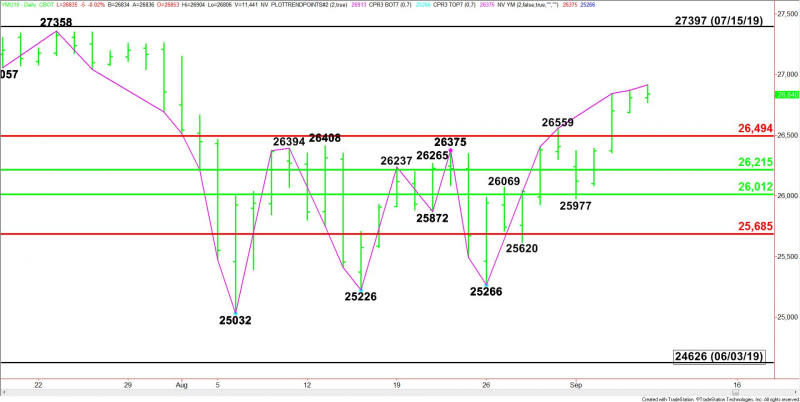
The main trend is up according to the daily swing chart. The uptrend was reaffirmed on Monday when buyers took out Friday’s high at 26869, however, the rally stalled at 26913. This was the second consecutive day that the new high barely took out the previous high. This could be a sign that investors are becoming a little shy about buying strength, making the market ripe for a short-term correction.
Tuesday’s session will begin with the Dow up 10 days since its last main bottom. This will put it in the window of time for a potentially bearish closing price reversal top. This won’t change the main trend to down, but it could lead to a two to three day correction.
The minor trend is also up. A trade through 25977 will change the minor trend to down. This will shift momentum to the downside.
The short-term range is 27397 to 25032. Its retracement zone at 26494 to 26215 is the nearest support zone.
The major support zone is 26012 to 25685.
Daily Swing Chart Technical Forecast
With the September E-mini Dow Jones Industrial Average futures contract inside the window of time for a closing price reversal top, we’re going to focus on Monday’s high at 26913.
Bullish Scenario
A sustained move over 26913 will indicate the presence of buyers. If the buying continues to increase over this level then this will put the Dow on a path toward the July 23 main top at 27358 and the all-time futures contract high at 27397.
Bearish Scenario
A sustained move under 26913 will signal the presence of sellers. If buyers take out 26913 then the Dow turns lower, then this move will put the market in a position to post a closing price reversal top. If the selling pressure continues then look for a possible break into the short-term Fibonacci level at 26494.
This article was originally posted on FX Empire
More From FXEMPIRE:
Bitcoin Cash – ABC, Litecoin and Ripple Daily Analysis – 10/09/19
Gold Price Futures (GC) Technical Analysis – Headed into Value Zone at $1489.20 to $1461.30
U.S. Dollar Index Futures (DX) Technical Analysis – Establishing Support at 98.350 to 98.120
USD/JPY Fundamental Daily Forecast – Traders Reacting to Rising Treasury Yields
