
 Yahoo Finance
 E-mini Dow Jones Industrial Average (YM) Futures Analysis – Strengthens Over 24877, Weakens Under 24824
The blue chip index is trading slightly lower early Monday. The market is also trading inside Friday’s range which suggests investor indecision and impending volatility. On Friday, the market nearly posted a closing price reversal bottom. It closed lower and below the opening, but the close above the mid-point suggested a slight shift in momentum to the upside.
At 0439 GMT, December E-mini Dow Jones Industrial Average futures are trading 24736, down 10 or -0.04%.
Daily Swing Chart Technical Analysis
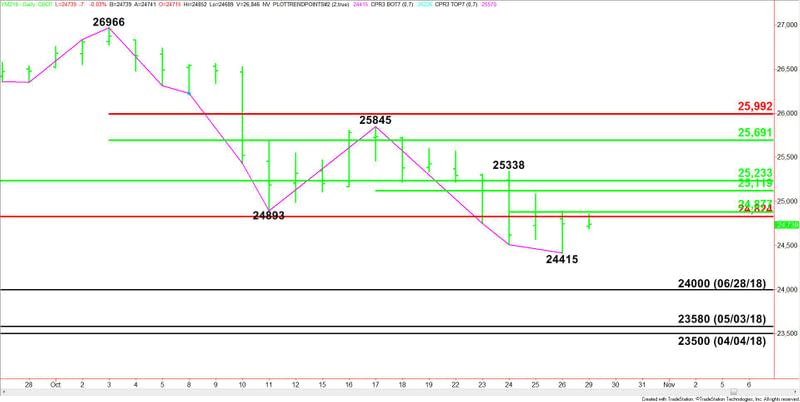
The main trend is down according to the daily swing chart. A trade through 24415 will signal a resumption of the downtrend. A trade through 25845 will change the main trend to up.
Due to the prolonged move down in terms of price and time, the Dow also begins the session in the window of time for a closing price reversal bottom.
The minor trend is also down. A trade through 25338 will change the minor trend to up. This will also shift momentum to the upside.
The major range is 23500 to 26966. Its retracement zone is 25233 to 24824. This zone is controlling the longer-term direction of the market.
The minor range is 25338 to 24415. Its 50% level or pivot is 24877. This level is controlling the short-term direction of the Dow.
Another minor range is 25845 to 24415. Its 50% level comes in at 25119.
The main range is 26966 to 24415. Its retracement zone at 25691 to 25992 is the primary upside target.
Daily Swing Chart Technical Forecast
Based on the early trade, the direction of the December E-mini Dow Jones Industrial Average is likely to be determined by trader reaction to the major Fibonacci level at 24824.
Bullish Scenario
A sustained move over 24824 will indicate the presence of buyers. This could lead to a quick move into the minor 50% level at 24877.
The pivot at 24877 is also a trigger point for an acceleration into a pair of 50% levels at 25119 and 25233. This is followed by the minor top at 25338.
Taking out 25338 will change the minor trend to up and shift momentum to the upside. It’s also the trigger point for an acceleration to the upside with the major 50% level at 25691 the next target.
Bearish Scenario
A sustained move under 24824 will signal the presence of sellers. The daily chart is open until 24415. Taking out this level will signal a resumption of the downtrend with the June 28 bottom at 24000 the next likely downside target.
This article was originally posted on FX Empire
