
 Yahoo Finance
 Dow Jones 30 and NASDAQ 100 Price forecast for the week of January 22, 2018, Technical Analysis
Dow Jones 30
The Dow Jones 30 initially rally during the week but to get back enough the gains to form a candle the looks roughly like a shooting star. I don’t think that this is a major breakdown waiting to happen, but what I do think happens is that the market could drift towards the 25,000 level again. I would love to see some type a significant pullback so that I can take advantage of value, in a market that has plenty of reasons to go higher, just perhaps has gotten a bit of ahead of itself. I believe that the value proposition below is quite enticing, as corporate profits continue to gain in America, just as the US dollar has been following a downward trajectory.
Dow Jones 30 and NASDAQ Index Video 22.01.18
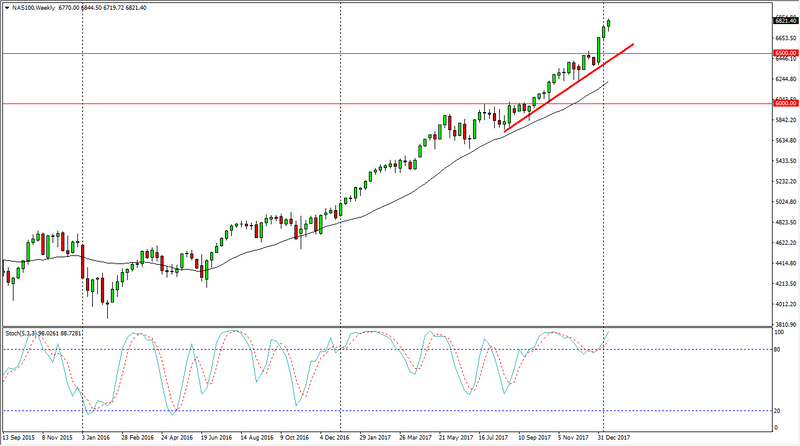
NASDAQ 100
The NASDAQ 100 initially fell during the week but then turned around to rally significantly. We are pressing a significant level in the form of the 6050 handle, but I think that breaking above the top of the candle is a buying opportunity, and I also recognize that the NASDAQ 100 may lead the way for other indices in America finally. It has been a laggard, but it looks like the buyers are starting to become a bit more aggressive. If we break down below the bottom of the candle stick, then I think we go looking towards the 6500 level underneath where we should find a massive amount of support. I like buying dips, but this index might be the one that doesn’t dip.
This article was originally posted on FX Empire
More From FXEMPIRE:
GBP/USD Price forecast for the week of January 22, 2018, Technical Analysis
DAX Index Price forecast for the week of January 22, 2018, Technical Analysis
USD/JPY Price forecast for the week of January 22, 2018, Technical Analysis
BTC/USD Price forecast for the week of January 22, 2018, Technical Analysis
GBP/JPY Price forecast for the week of January 22, 2018, Technical Analysis
NZD/USD Price forecast for the week of January 22, 2018, Technical Analysis
