
 Yahoo Finance
 Does Serial System Ltd’s (SGX:S69) -12.97% Earnings Drop Reflect A Longer Term Trend?
Assessing Serial System Ltd’s (SGX:S69) past track record of performance is a valuable exercise for investors. It enables us to reflect on whether the company has met or exceed expectations, which is a great indicator for future performance. Today I will assess S69’s recent performance announced on 31 March 2018 and evaluate these figures to its longer term trend and industry movements. View out our latest analysis for Serial System
How Did S69’s Recent Performance Stack Up Against Its Past?
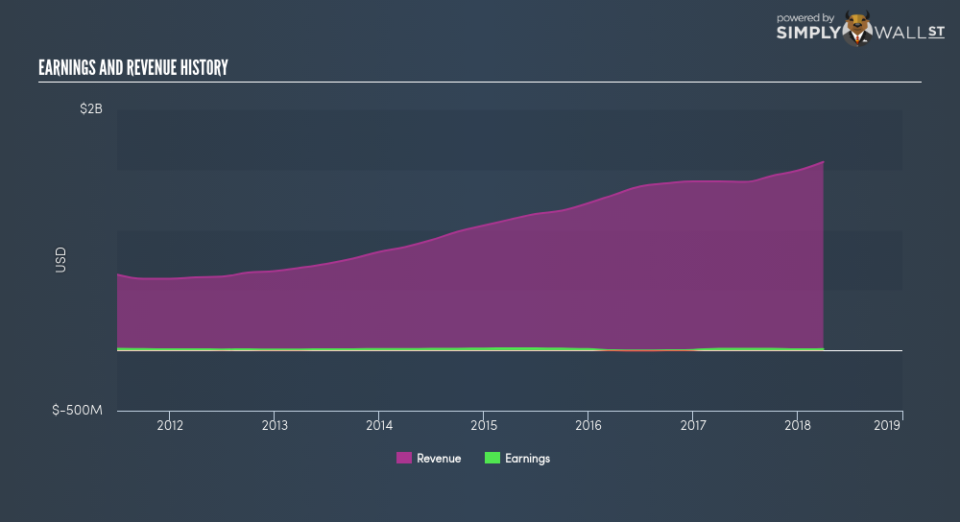
S69’s trailing twelve-month earnings (from 31 March 2018) of S$12.03m has declined by -12.97% compared to the previous year. Furthermore, this one-year growth rate has been lower than its average earnings growth rate over the past 5 years of -0.99%, indicating the rate at which S69 is growing has slowed down. What could be happening here? Well, let’s look at what’s going on with margins and if the rest of the industry is facing the same headwind.
Revenue growth over the last few years, has been positive, nevertheless earnings growth has been declining. This suggest that Serial System has been growing expenses, which is hurting margins and earnings, and is not a sustainable practice. Viewing growth from a sector-level, the SG electronic industry has been growing its average earnings by double-digit 32.88% in the past year, and a more muted 8.04% over the past five. This suggests that any tailwind the industry is profiting from, Serial System has not been able to gain as much as its average peer.
In terms of returns from investment, Serial System has not invested its equity funds well, leading to a 9.48% return on equity (ROE), below the sensible minimum of 20%. Furthermore, its return on assets (ROA) of 3.89% is below the SG Electronic industry of 5.30%, indicating Serial System’s are utilized less efficiently. And finally, its return on capital (ROC), which also accounts for Serial System’s debt level, has declined over the past 3 years from 13.78% to 13.15%. This correlates with an increase in debt holding, with debt-to-equity ratio rising from 89.24% to 146.48% over the past 5 years.
What does this mean?
Serial System’s track record can be a valuable insight into its earnings performance, but it certainly doesn’t tell the whole story. Companies that are profitable, but have volatile earnings, can have many factors affecting its business. You should continue to research Serial System to get a better picture of the stock by looking at:
Future Outlook: What are well-informed industry analysts predicting for S69’s future growth? Take a look at our free research report of analyst consensus for S69’s outlook.
Financial Health: Is S69’s operations financially sustainable? Balance sheets can be hard to analyze, which is why we’ve done it for you. Check out our financial health checks here.
Other High-Performing Stocks: Are there other stocks that provide better prospects with proven track records? Explore our free list of these great stocks here.
NB: Figures in this article are calculated using data from the trailing twelve months from 31 March 2018. This may not be consistent with full year annual report figures.
To help readers see pass the short term volatility of the financial market, we aim to bring you a long-term focused research analysis purely driven by fundamental data. Note that our analysis does not factor in the latest price sensitive company announcements.
The author is an independent contributor and at the time of publication had no position in the stocks mentioned.
