
 Yahoo Finance
 How Does AstraZeneca PLC (LON:AZN) Fare As A Dividend Stock?

A sizeable part of portfolio returns can be produced by dividend stocks due to their contribution to compounding returns in the long run. Over the past 10 years, AstraZeneca PLC (LSE:AZN) has returned an average of 5.00% per year to shareholders in terms of dividend yield. Does AstraZeneca tick all the boxes of a great dividend stock? Below, I’ll take you through my analysis. Check out our latest analysis for AstraZeneca
5 questions I ask before picking a dividend stock
When researching a dividend stock, I always follow the following screening criteria:
Is their annual yield among the top 25% of dividend payers?
Has its dividend been stable over the past (i.e. no missed payments or significant payout cuts)?
Has dividend per share risen in the past couple of years?
Does earnings amply cover its dividend payments?
Will the company be able to keep paying dividend based on the future earnings growth?
Does AstraZeneca pass our checks?
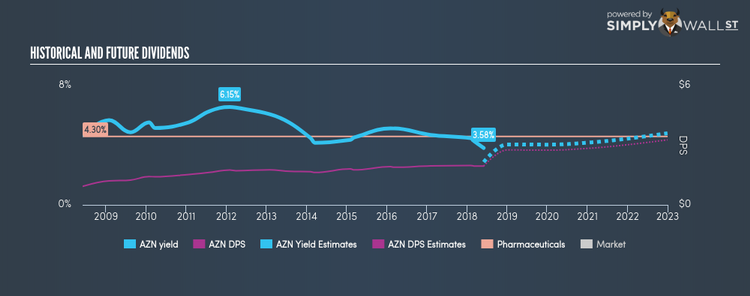
AstraZeneca has a trailing twelve-month payout ratio of 126.44%, which means that the dividend is not well-covered by its earnings. In the near future, analysts are predicting a more sensible payout ratio of 57.38%, leading to a dividend yield of around 3.90%. EPS is also forecasted to fall to $1.85 in the upcoming year. The lower EPS on top of a lower payout ratio will lead to a fall in dividend payment moving forward. If there’s one type of stock you want to be reliable, it’s dividend stocks and their stable income-generating ability. AZN has increased its DPS from $0.93 to $1.96 in the past 10 years. During this period it has not missed a payment, as one would expect for a company increasing its dividend. These are all positive signs of a great, reliable dividend stock. Relative to peers, AstraZeneca produces a yield of 3.58%, which is on the low-side for Pharmaceuticals stocks.
Next Steps:
Considering the dividend attributes we analyzed above, AstraZeneca is definitely worth keeping an eye on for someone looking to build a dedicated income portfolio. Given that this is purely a dividend analysis, I recommend taking sufficient time to understand its core business and determine whether the company and its investment properties suit your overall goals. I’ve put together three fundamental aspects you should further research:
Future Outlook: What are well-informed industry analysts predicting for AZN’s future growth? Take a look at our free research report of analyst consensus for AZN’s outlook.
Valuation: What is AZN worth today? Even if the stock is a cash cow, it’s not worth an infinite price. The intrinsic value infographic in our free research report helps visualize whether AZN is currently mispriced by the market.
Other Dividend Rockstars: Are there better dividend payers with stronger fundamentals out there? Check out our free list of these great stocks here.
To help readers see pass the short term volatility of the financial market, we aim to bring you a long-term focused research analysis purely driven by fundamental data. Note that our analysis does not factor in the latest price sensitive company announcements.
The author is an independent contributor and at the time of publication had no position in the stocks mentioned.
