
 Yahoo Finance
 How Does Alpha and Omega Semiconductor Limited’s (NASDAQ:AOSL) Earnings Growth Stack Up Against Industry Performance?

Improvement in profitability and outperformance against the industry can be important characteristics in a stock for some investors. Below, I will assess Alpha and Omega Semiconductor Limited’s (NASDAQ:AOSL) track record on a high level, to give you some insight into how the company has been performing against its historical trend and its industry peers. See our latest analysis for Alpha and Omega Semiconductor
How AOSL fared against its long-term earnings performance and its industry
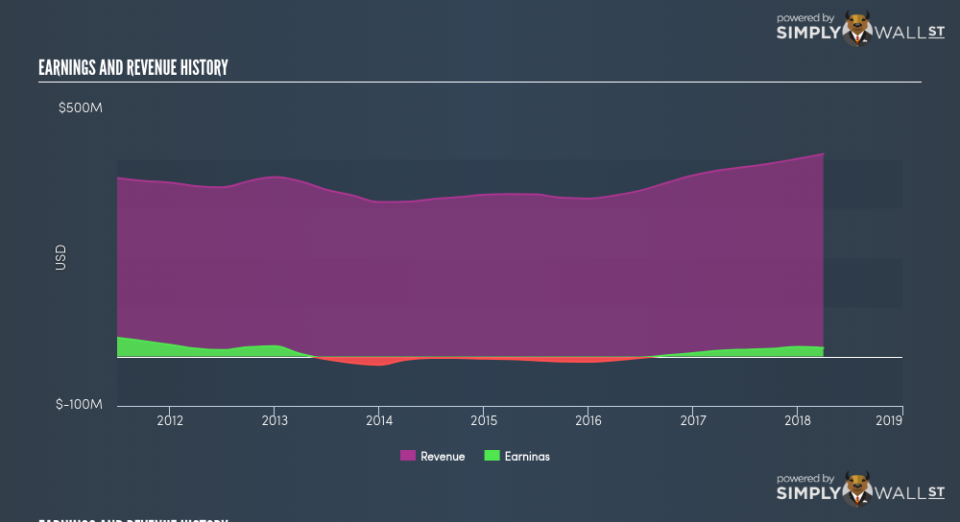
AOSL’s trailing twelve-month earnings (from 31 March 2018) of US$17.36m has jumped 49.27% compared to the previous year. Furthermore, this one-year growth rate has exceeded its 5-year annual growth average of -14.59%, indicating the rate at which AOSL is growing has accelerated. How has it been able to do this? Let’s see if it is only because of industry tailwinds, or if Alpha and Omega Semiconductor has seen some company-specific growth.
Over the past few years, Alpha and Omega Semiconductor top-line expansion has outstripped earnings and the growth rate of expenses. Though this brought about a margin contraction, it has softened Alpha and Omega Semiconductor’s earnings contraction. Looking at growth from a sector-level, the US semiconductor industry has been growing its average earnings by double-digit 28.19% over the past year, and 13.91% over the previous five years. This means any tailwind the industry is enjoying, Alpha and Omega Semiconductor is capable of amplifying this to its advantage.
In terms of returns from investment, Alpha and Omega Semiconductor has not invested its equity funds well, leading to a 2.47% return on equity (ROE), below the sensible minimum of 20%. Furthermore, its return on assets (ROA) of 2.95% is below the US Semiconductor industry of 7.88%, indicating Alpha and Omega Semiconductor’s are utilized less efficiently. However, its return on capital (ROC), which also accounts for Alpha and Omega Semiconductor’s debt level, has increased over the past 3 years from -0.71% to 2.57%. This correlates with a decrease in debt holding, with debt-to-equity ratio declining from 6.85% to 3.23% over the past 5 years.
What does this mean?
Alpha and Omega Semiconductor’s track record can be a valuable insight into its earnings performance, but it certainly doesn’t tell the whole story. Companies that have performed well in the past, such as Alpha and Omega Semiconductor gives investors conviction. However, the next step would be to assess whether the future looks as optimistic. You should continue to research Alpha and Omega Semiconductor to get a more holistic view of the stock by looking at:
Financial Health: Is AOSL’s operations financially sustainable? Balance sheets can be hard to analyze, which is why we’ve done it for you. Check out our financial health checks here.
Valuation: What is AOSL worth today? Is the stock undervalued, even when its growth outlook is factored into its intrinsic value? The intrinsic value infographic in our free research report helps visualize whether AOSL is currently mispriced by the market.
Other High-Performing Stocks: Are there other stocks that provide better prospects with proven track records? Explore our free list of these great stocks here.
NB: Figures in this article are calculated using data from the trailing twelve months from 31 March 2018. This may not be consistent with full year annual report figures.
To help readers see pass the short term volatility of the financial market, we aim to bring you a long-term focused research analysis purely driven by fundamental data. Note that our analysis does not factor in the latest price sensitive company announcements.
The author is an independent contributor and at the time of publication had no position in the stocks mentioned.
