
 Yahoo Finance
 Did NuStar Energy LP (NYSE:NS) Create Value For Investors Over The Past Year?

This article is intended for those of you who are at the beginning of your investing journey and want a simplistic look at the return on NuStar Energy LP (NYSE:NS) stock.
NuStar Energy LP (NYSE:NS) generated a below-average return on equity of 8.67% in the past 12 months, while its industry returned 11.36%. Though NS’s recent performance is underwhelming, it is useful to understand what ROE is made up of and how it should be interpreted. Knowing these components can change your views on NS’s below-average returns. Today I will look at how components such as financial leverage can influence ROE which may impact the sustainability of NS’s returns. See our latest analysis for NuStar Energy
Breaking down Return on Equity
Return on Equity (ROE) weighs NuStar Energy’s profit against the level of its shareholders’ equity. For example, if the company invests $1 in the form of equity, it will generate $0.087 in earnings from this. While a higher ROE is preferred in most cases, there are several other factors we should consider before drawing any conclusions.
Return on Equity = Net Profit ÷ Shareholders Equity
ROE is assessed against cost of equity, which is measured using the Capital Asset Pricing Model (CAPM) – but let’s not dive into the details of that today. For now, let’s just look at the cost of equity number for NuStar Energy, which is 16.07%. Since NuStar Energy’s return does not cover its cost, with a difference of -7.39%, this means its current use of equity is not efficient and not sustainable. Very simply, NuStar Energy pays more for its capital than what it generates in return. ROE can be broken down into three different ratios: net profit margin, asset turnover, and financial leverage. This is called the Dupont Formula:
Dupont Formula
ROE = profit margin × asset turnover × financial leverage
ROE = (annual net profit ÷ sales) × (sales ÷ assets) × (assets ÷ shareholders’ equity)
ROE = annual net profit ÷ shareholders’ equity

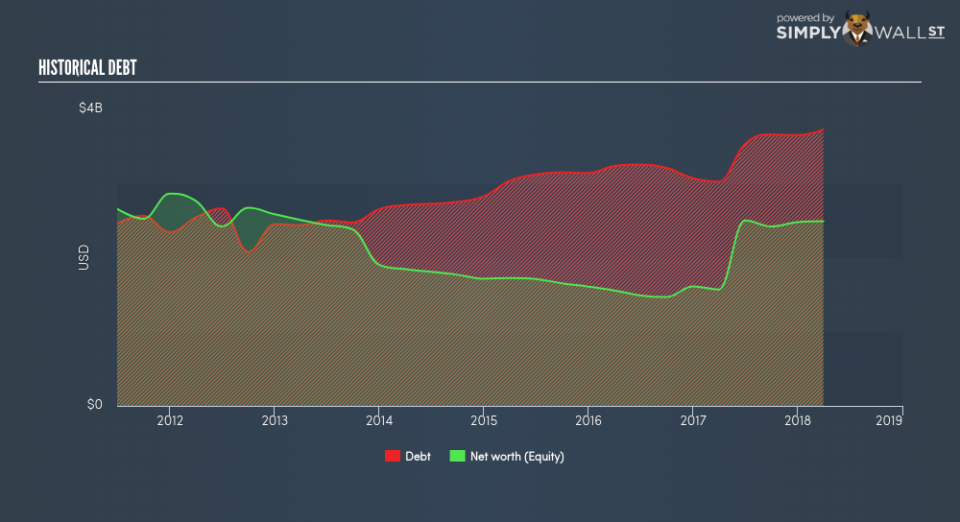
Essentially, profit margin shows how much money the company makes after paying for all its expenses. Asset turnover reveals how much revenue can be generated from NuStar Energy’s asset base. And finally, financial leverage is simply how much of assets are funded by equity, which exhibits how sustainable the company’s capital structure is. Since financial leverage can artificially inflate ROE, we need to look at how much debt NuStar Energy currently has. At 149.54%, NuStar Energy’s debt-to-equity ratio appears balanced and indicates its ROE is generated from its capacity to increase profit without a large debt burden.
Next Steps:
ROE is one of many ratios which meaningfully dissects financial statements, which illustrates the quality of a company. NuStar Energy’s below-industry ROE is disappointing, furthermore, its returns were not even high enough to cover its own cost of equity. However, ROE is not likely to be inflated by excessive debt funding, giving shareholders more conviction in the sustainability of returns, which has headroom to increase further. Although ROE can be a useful metric, it is only a small part of diligent research.
For NuStar Energy, I’ve put together three pertinent factors you should further examine:
Financial Health: Does it have a healthy balance sheet? Take a look at our free balance sheet analysis with six simple checks on key factors like leverage and risk.
Management:Have insiders been ramping up their shares to take advantage of the market’s sentiment for NuStar Energy’s future outlook? Check out our management and board analysis with insights on CEO compensation and governance factors.
Other High-Growth Alternatives : Are there other high-growth stocks you could be holding instead of NuStar Energy? Explore our interactive list of stocks with large growth potential to get an idea of what else is out there you may be missing!
To help readers see pass the short term volatility of the financial market, we aim to bring you a long-term focused research analysis purely driven by fundamental data. Note that our analysis does not factor in the latest price sensitive company announcements.
The author is an independent contributor and at the time of publication had no position in the stocks mentioned.
