D2L Inc. (TSE:DTOL) boasts of bullish insider sentiment with 52% ownership and they have been buying lately
Key Insights
Significant insider control over D2L implies vested interests in company growth
John Baker owns 52% of the company
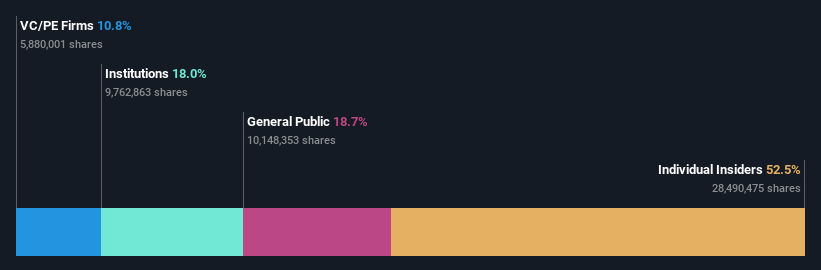
If you want to know who really controls D2L Inc. (TSE:DTOL), then you'll have to look at the makeup of its share registry. The group holding the most number of shares in the company, around 52% to be precise, is individual insiders. Put another way, the group faces the maximum upside potential (or downside risk).
A quick look at our data suggests that insiders have been buying shares in the company recently. This might indicate that they expect share prices to rise in the near future.
Let's take a closer look to see what the different types of shareholders can tell us about D2L.
See our latest analysis for D2L
What Does The Institutional Ownership Tell Us About D2L?
Many institutions measure their performance against an index that approximates the local market. So they usually pay more attention to companies that are included in major indices.
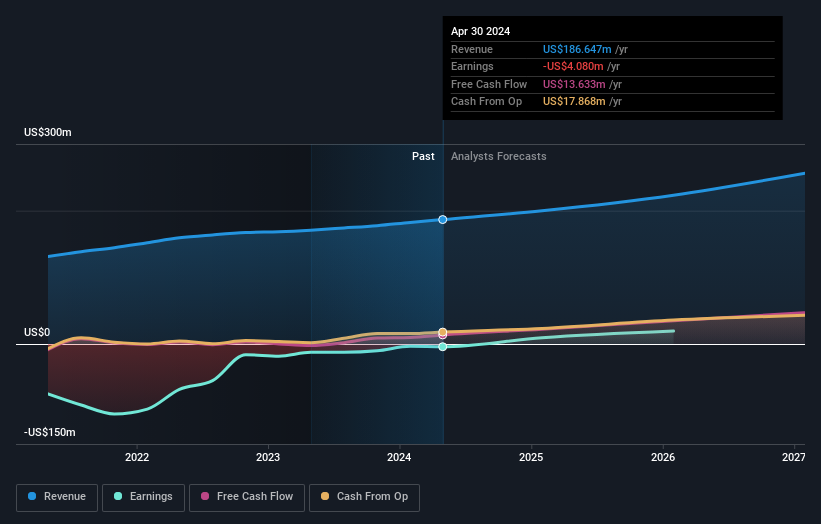
As you can see, institutional investors have a fair amount of stake in D2L. This suggests some credibility amongst professional investors. But we can't rely on that fact alone since institutions make bad investments sometimes, just like everyone does. It is not uncommon to see a big share price drop if two large institutional investors try to sell out of a stock at the same time. So it is worth checking the past earnings trajectory of D2L, (below). Of course, keep in mind that there are other factors to consider, too.
D2L is not owned by hedge funds. Looking at our data, we can see that the largest shareholder is the CEO John Baker with 52% of shares outstanding. This essentially means that they have significant control over the outcome or future of the company, which is why insider ownership is usually looked upon favourably by prospective buyers. In comparison, the second and third largest shareholders hold about 11% and 5.3% of the stock.
Researching institutional ownership is a good way to gauge and filter a stock's expected performance. The same can be achieved by studying analyst sentiments. There are a reasonable number of analysts covering the stock, so it might be useful to find out their aggregate view on the future.
Insider Ownership Of D2L
While the precise definition of an insider can be subjective, almost everyone considers board members to be insiders. Management ultimately answers to the board. However, it is not uncommon for managers to be executive board members, especially if they are a founder or the CEO.
I generally consider insider ownership to be a good thing. However, on some occasions it makes it more difficult for other shareholders to hold the board accountable for decisions.
Our information suggests that insiders own more than half of D2L Inc.. This gives them effective control of the company. Given it has a market cap of CA$654m, that means they have CA$343m worth of shares. It is good to see this level of investment. You can check here to see if those insiders have been buying recently.
General Public Ownership
The general public, who are usually individual investors, hold a 19% stake in D2L. While this size of ownership may not be enough to sway a policy decision in their favour, they can still make a collective impact on company policies.
Private Equity Ownership
With a stake of 11%, private equity firms could influence the D2L board. Some investors might be encouraged by this, since private equity are sometimes able to encourage strategies that help the market see the value in the company. Alternatively, those holders might be exiting the investment after taking it public.
Next Steps:
I find it very interesting to look at who exactly owns a company. But to truly gain insight, we need to consider other information, too.
I always like to check for a history of revenue growth. You can too, by accessing this free chart of historic revenue and earnings in this detailed graph.
Ultimately the future is most important. You can access this free report on analyst forecasts for the company.
NB: Figures in this article are calculated using data from the last twelve months, which refer to the 12-month period ending on the last date of the month the financial statement is dated. This may not be consistent with full year annual report figures.
Have feedback on this article? Concerned about the content? Get in touch with us directly. Alternatively, email editorial-team (at) simplywallst.com.
This article by Simply Wall St is general in nature. We provide commentary based on historical data and analyst forecasts only using an unbiased methodology and our articles are not intended to be financial advice. It does not constitute a recommendation to buy or sell any stock, and does not take account of your objectives, or your financial situation. We aim to bring you long-term focused analysis driven by fundamental data. Note that our analysis may not factor in the latest price-sensitive company announcements or qualitative material. Simply Wall St has no position in any stocks mentioned.
Have feedback on this article? Concerned about the content? Get in touch with us directly. Alternatively, email editorial-team@simplywallst.com